These five charts unpack the trends and cost drivers shaping today’s electricity prices—and what these trends mean for households and related policies.
Electricity affordability has become a top concern for US energy policy. In the past few years, affordability has been invoked to justify policies that range from expanding rate-assistance programs and clean energy subsidies to rolling back environmental regulations and electric vehicle (EV) mandates. From the president’s numerous executive orders that emphasize energy costs to the proposed Energy Affordability, Independence, and Innovation Act in Massachusetts, leaders across the political spectrum warn of a growing affordability crisis for US households. Publicly available data suggest that some of these fears may be well founded.
In 2024, the National Energy Assistance Directors Association found that nearly 25 percent of US households and one-third of homes with children would be unable to afford their energy bills over the summer. High bills have led to unsafe behaviors, such as underheating or undercooling homes; dangerous coping strategies to escape the cold (e.g., sitting in cars with the heat running, burning trash for heat, sleeping near a burning fire); or forgoing basic household necessities, such as food and medicine. According to the 2024 Census Household Pulse Survey, 34% of households reported cutting back on basic household necessities, such as medicine or food, to pay for an energy bill. High prices also slow the electrification of buildings and vehicles, a key strategy for combating climate change. We set out to investigate the drivers of this household strain, including electricity grid and fuel costs, as well as broader economic conditions.
The current affordability challenge is set against the backdrop of a clean energy transition and an explosion of new demand sources, including energy-intensive artificial intelligence (AI), in the United States. New energy technologies are challenging the traditional paradigms for attracting and compensating electricity resources, while new, large electricity customers are driving an urgent need for the rapid expansion of grid infrastructure and energy generation.
As the electricity industry considers the future of the power sector, experts are asking, How can policymakers continue to drive the energy transition and be an AI leader while ensuring affordable power for all?
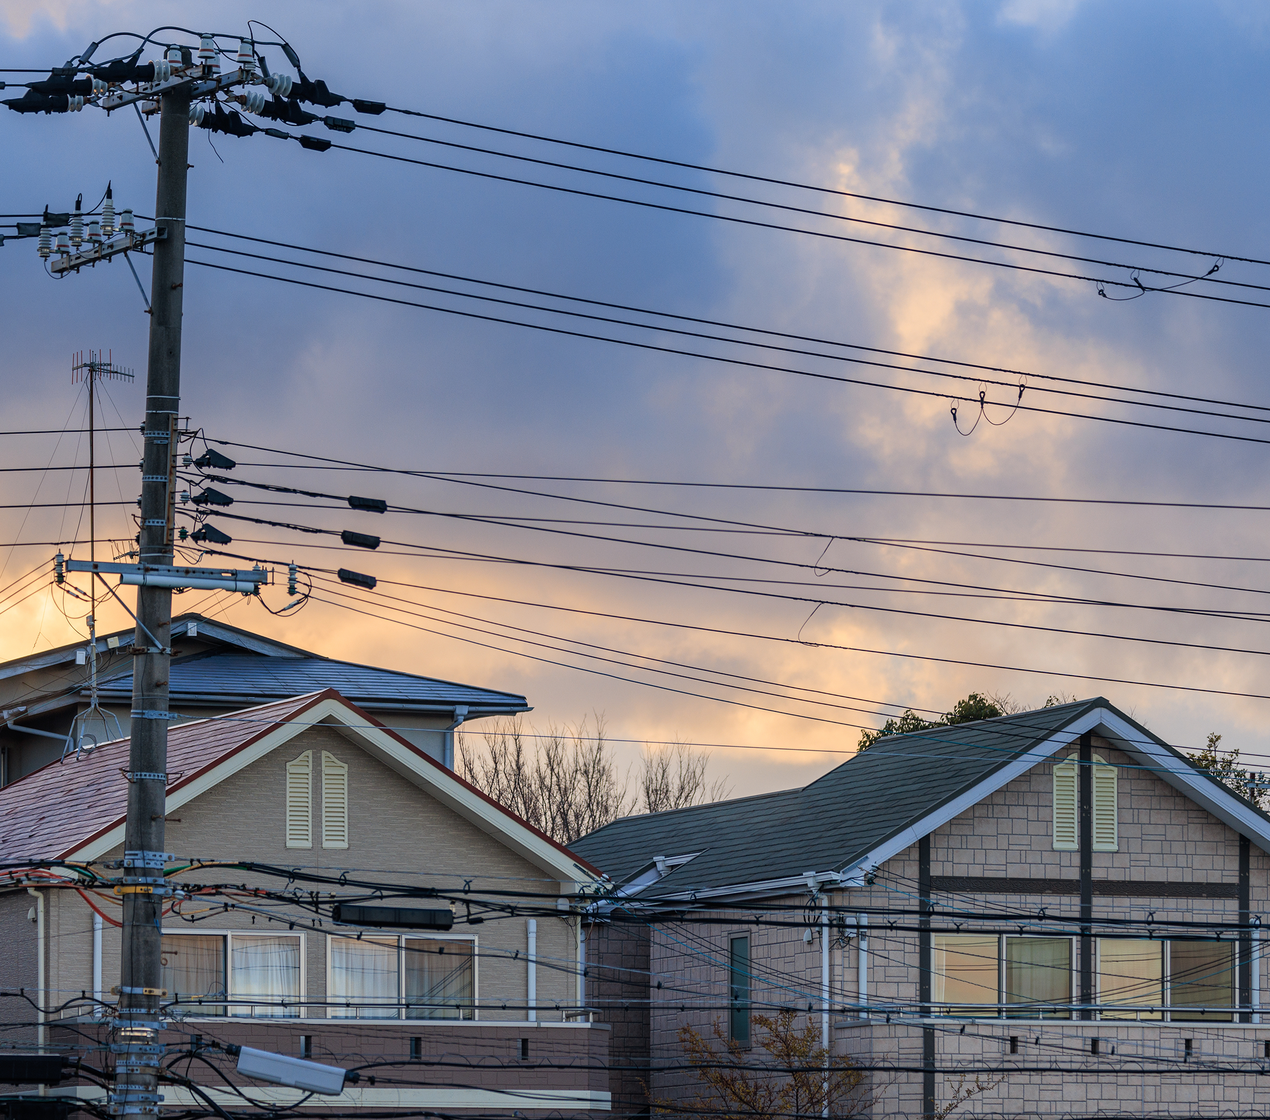
Credit: Denis Lubsanov / Shutterstock
In this article, we explore recent trends in average residential electricity prices and some underlying causes of the changes that we see. We use data sets (many accessed through the Public Utility Data Liberation Project) from the US Energy Information Administration, the Bureau of Labor Statistics, and the Federal Energy Regulatory Commission. These data document how US electricity prices have changed from 2001 to 2024, how resulting costs have changed, and the various components of costs. Collectively, analyzing these data help us explore some of the underlying causes of changes in electricity prices. Note that certain data series have data available only through 2023. In all charts, we show all available data.
Policy discussions on electricity affordability are complicated by the fact that the concept of affordability can describe a wide variety of ideas, including limiting utility costs, limiting retail electricity prices, measuring electricity bills against household income, and implementing programs that help low-income households pay their bills and maintain access to electricity. Ultimately, we hope to provide insights into how policy and practice can limit residential electricity costs and provide actionable starting points for regulators and policymakers who are looking to make electricity more affordable.
Are Electricity Prices Rising?
Nationally, average real electricity prices have risen in the past four years, after nearly two decades of flat or decreasing real prices. However, this increase is driven by certain regions of the country; many other regions have experienced stable electricity prices.
The United States has seen historic increases in nominal average electricity prices since 2021, and these prices have risen even faster than inflation during the same period (Chart 1). As of 2024, nominal electricity prices had risen 27% since 2019 and 21% since 2021, while inflation-adjusted prices (normalized by the Core Consumer Price Index as measured by the Bureau of Labor Statistics) had risen by 4.5% and 4.9%, respectively.
However, this recent increase comes on the heels of 15 years of electricity prices that grew more slowly than inflation, on average. In fact, current inflation-adjusted average US electricity prices are similar to or lower than the prices that prevailed during most of the 2010s.
Chart 1: Average US Residential Electricity Prices, 2001–2024
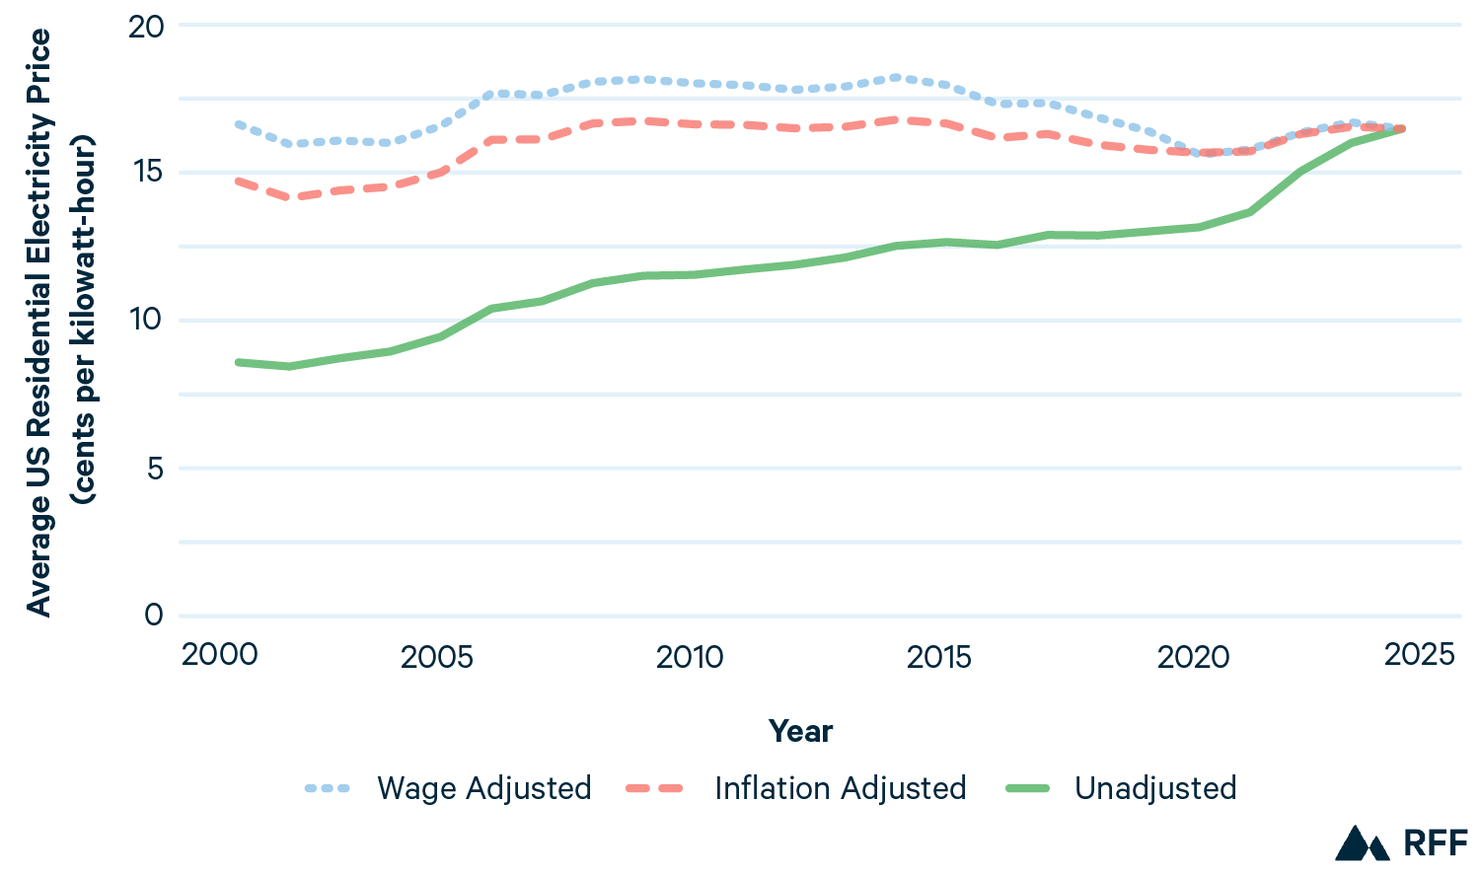
Although current inflation-adjusted average US electricity prices are similar to or lower than prices during most of the 2010s, some households may be struggling with the rapid change over the past few years. When electricity prices, inflation, and median wages all rise rapidly, as they have since 2021, the price increases may be felt most by households that have not experienced wage increases, including households in which members live on fixed incomes, work in sectors that experience slower wage growth, or are unemployed. Now, many of these households may be unable to afford their electricity bills.
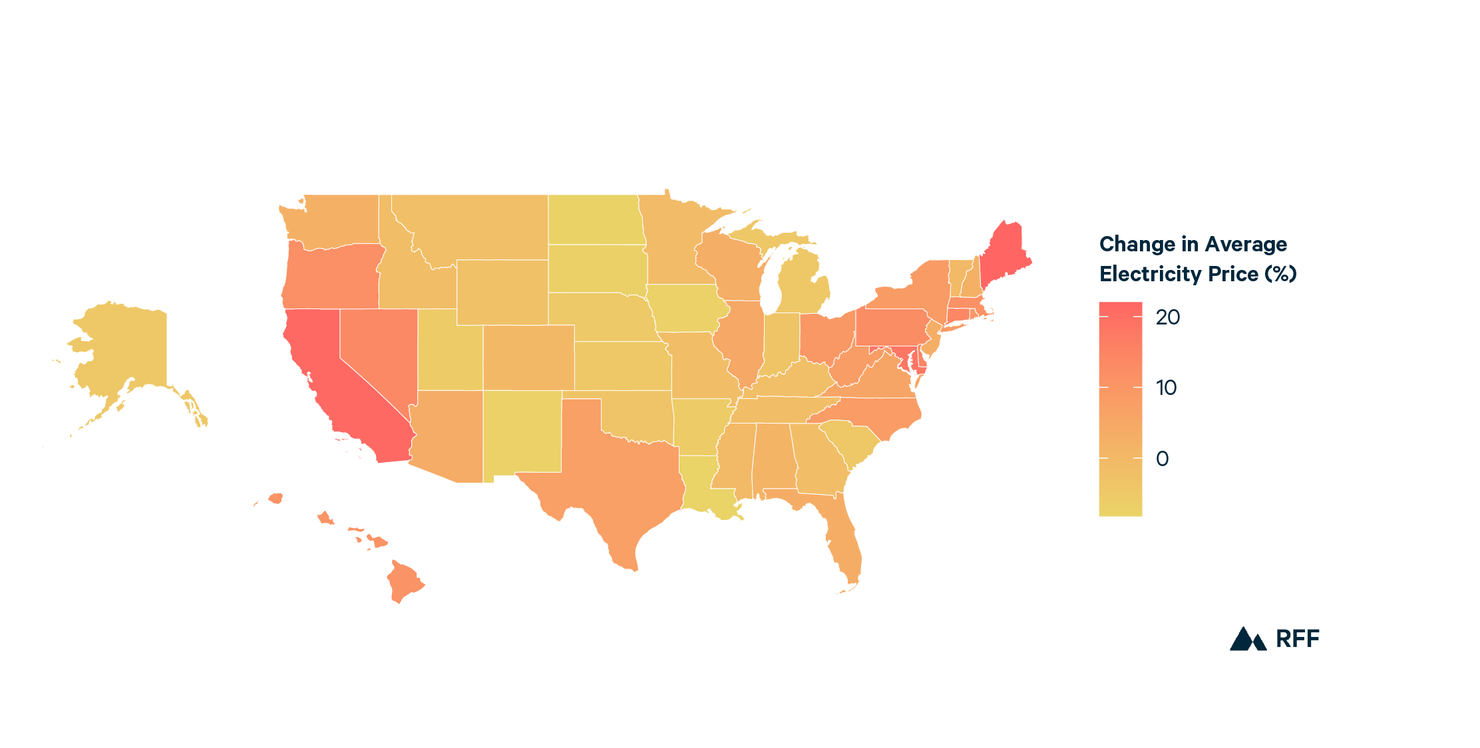
Average national prices also mask geographic disparities in recent price increases across the country. Electricity prices have not risen everywhere; only a few regions have experienced real price increases of over 10%. Chart 2 displays the change in average inflation-adjusted electricity price by state between 2021 and 2024. The largest price growth occurred in Maine and California, which both experienced increases of over 20% in real prices. Other regions with especially large price increases include the Northeast and Mid-Atlantic. In contrast, many states in the Central, Southeast, and Mountain regions experienced flat or decreasing prices during this time frame.
Chart 2: Percent Change in Inflation-Adjusted Electricity Prices, 2021–2024
What Is Driving the Recent Increases in Electricity Prices?
Recent electricity price increases coincide with a temporary spike in natural gas prices, but we also observe longer-term, steady increases in the cost of transmission and distribution.
Average electricity prices are effectively calculated as the total costs collected by utilities through electricity bills—including infrastructure costs, fuel costs, and profits—divided by electricity consumption. Average prices rise when overall costs increase or when electricity consumption declines. Electricity consumption has remained relatively flat or grown modestly over the past two decades, with average annual growth of less than 1% since 2001, so this discussion focuses on analyzing trends in the underlying costs.
Costs to the electricity system can be broken down into several broad categories. Power production costs accrue through generating the electrons that consumers use; transmission costs are incurred when transporting electricity across long distances, such as large power lines along the highway; and distribution costs arise when delivering electricity throughout a community. Utility companies also incur other costs, such as employee salaries and administrative expenses.
Chart 3 shows these costs over time, adjusted by inflation, in the 14 states with the highest price increases and Washington, DC, from 2021 to 2024 as shown in Chart 2. Chart 3 largely reflects trends in utility costs throughout the New England, Mid-Atlantic, and Pacific regions. In areas with retail competition, we include revenues from non-utility suppliers in power production.
Chart 3: Electricity Costs by Category for 14 US States with the Highest Recent Price Increases and Washington, DC, 2001–2023
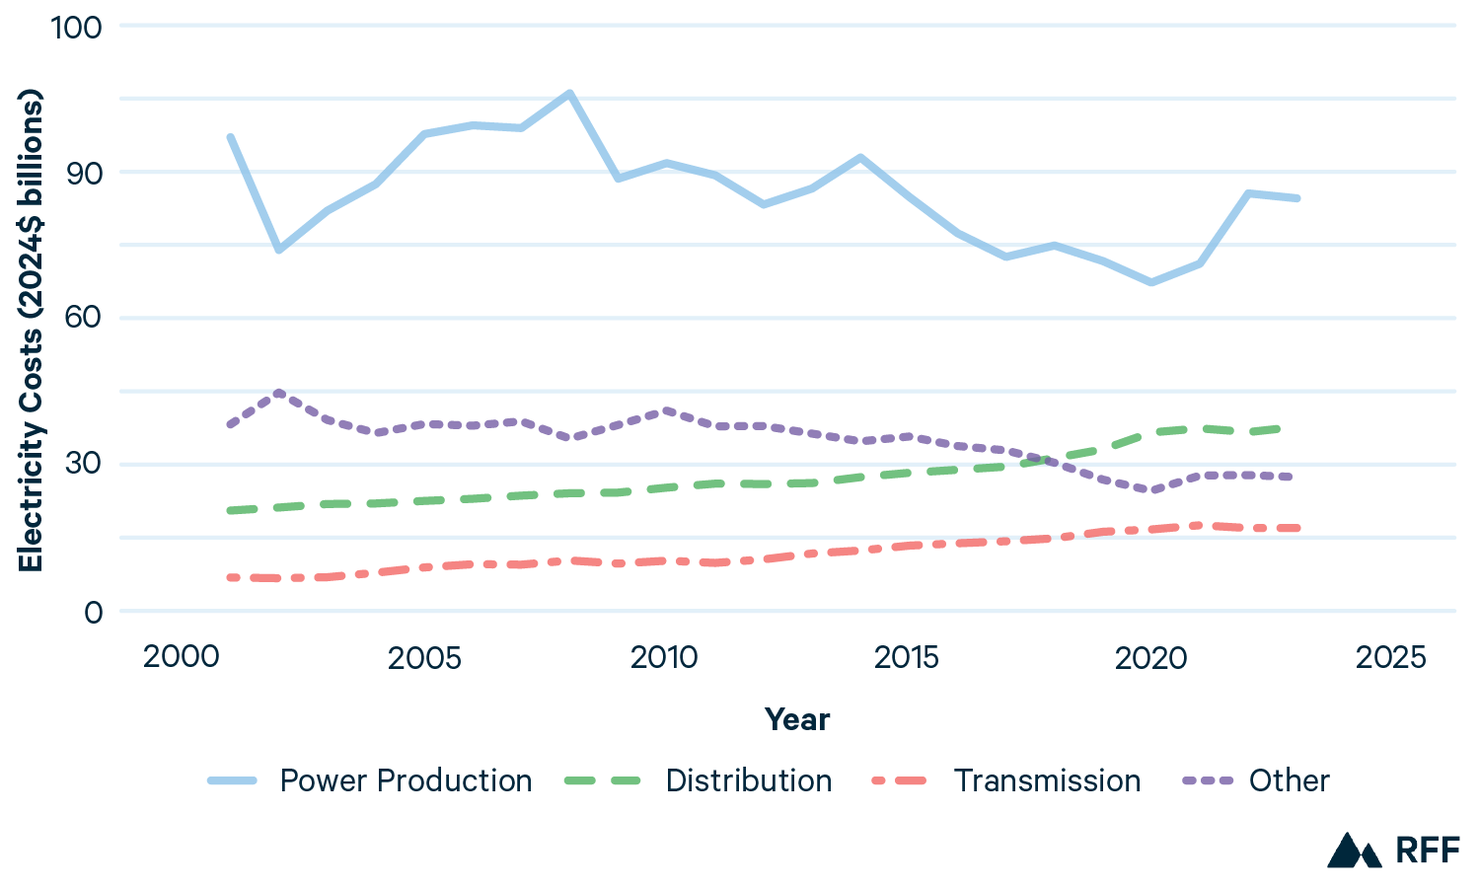
Notes: Data represent the 14 US states with the highest price increases during the time period represented, which are CA, CT, DE, HI, MA, MD, ME, NC, NV, NY, OH, OR, PA, and RI, along with Washington, DC.
The uptick in costs around 2021 primarily comes from power production, seemingly from the costs of natural gas generation in particular. From 2020 to 2022, a stark increase in the costs of power production aligned with a period of high global natural gas prices during the first years of the Russia-Ukraine war. However, the longer-term trend is a reduction in the costs of power production, as real natural gas prices generally have been decreasing since the boom in hydraulic fracturing methods to extract natural gas around 2010 and as new renewable generation has reduced fuel expenses. Although we do not have complete 2024 data, natural gas prices returned to roughly pre-conflict levels by 2024, and the data available indicate that power production costs decreased commensurately, suggesting that natural gas prices are a temporary driver of high electricity prices.
A short-term natural gas price shock may affect states differently for several reasons. Retail prices in restructured areas (where utilities and other suppliers purchase a large share of their electricity from a uniformly priced spot market) may be more sensitive to a natural gas price shock than in areas with traditionally regulated utilities that own most of their generation. Additionally, suppliers in some areas hedge more of their power production costs by signing long-term contracts with generators or companies that specialize in hedging power prices. Some areas also have a more diverse resource mix that includes a larger share of non–fossil fuel generation, which can reduce exposure to volatile prices for fossil fuels.
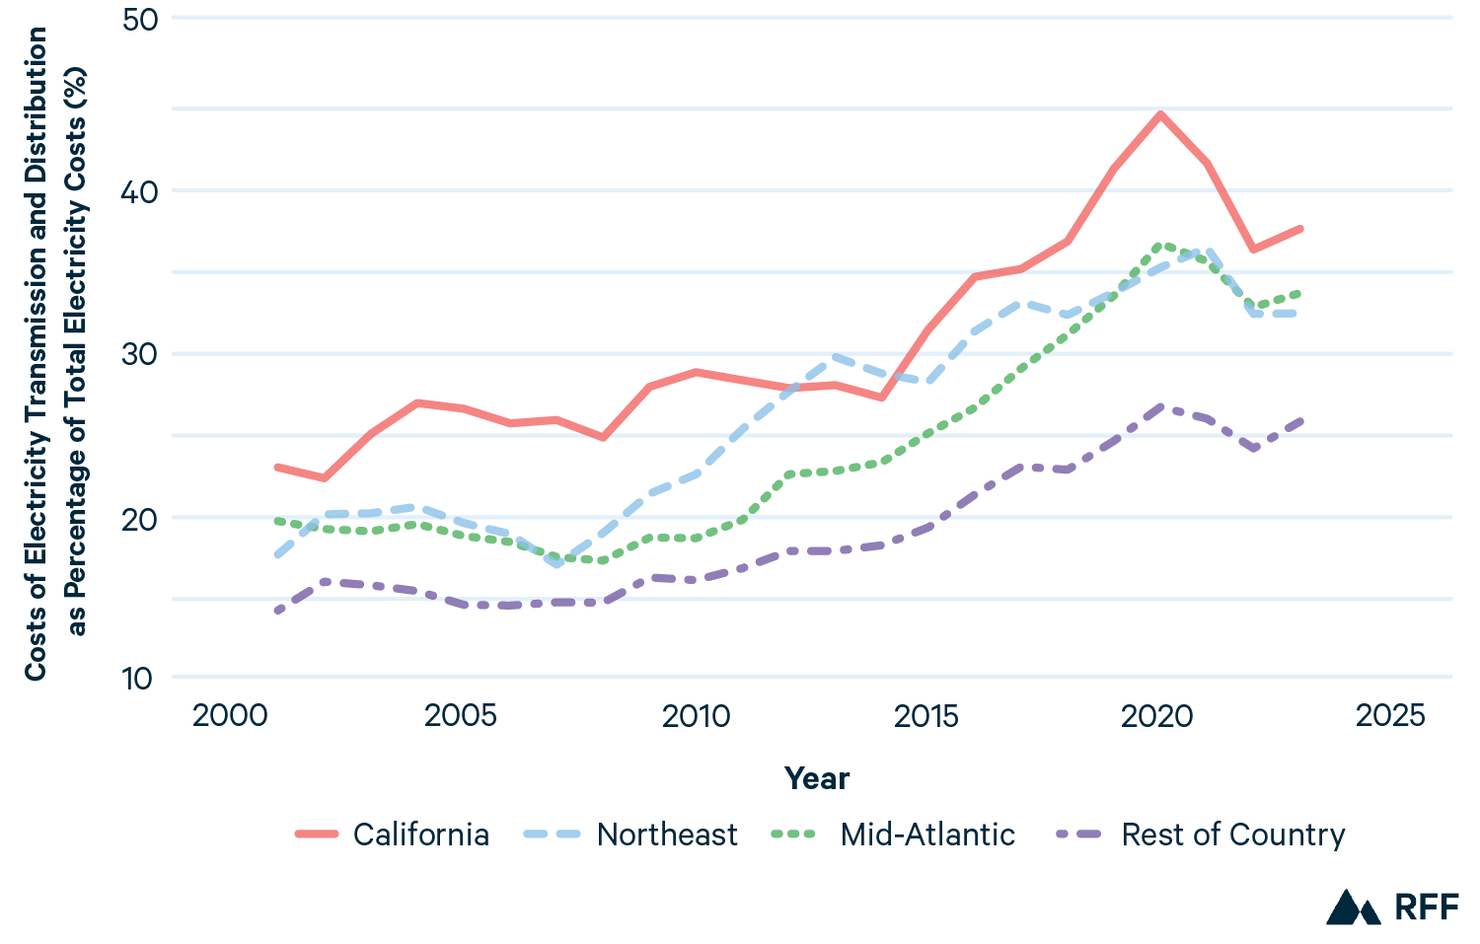
Chart 3 shows that the costs of transmission and distribution have been increasing steadily over time. This trend is especially stark in regions of the country where electricity price increases have been highest, including the Northeast, the Mid-Atlantic, and California. In California, for instance, inflation-adjusted distribution costs have increased by 18% since 2021. Chart 4 shows that these regions experienced larger increases in transmission and distribution costs as a share of total costs, relative to other regions.
Chart 4: Transmission and Distribution Costs as a Percentage of Total Electricity Costs by Region, 2001–2024
These cost increases reflect the higher costs of building new infrastructure for transmission and distribution or maintaining existing infrastructure. The increases are not related to increases in the distance that electricity is transported nor the number of distribution circuits.
Chart 5 displays the inflation-adjusted costs for transmission and distribution by region since 2013, normalized by the miles of transmission lines (top) and the number of distribution circuits (bottom), highlighting regions with the largest recent price increases.
Chart 5: Transmission Cost per Mile and Distribution Cost per Circuit by Region, 2013–2024
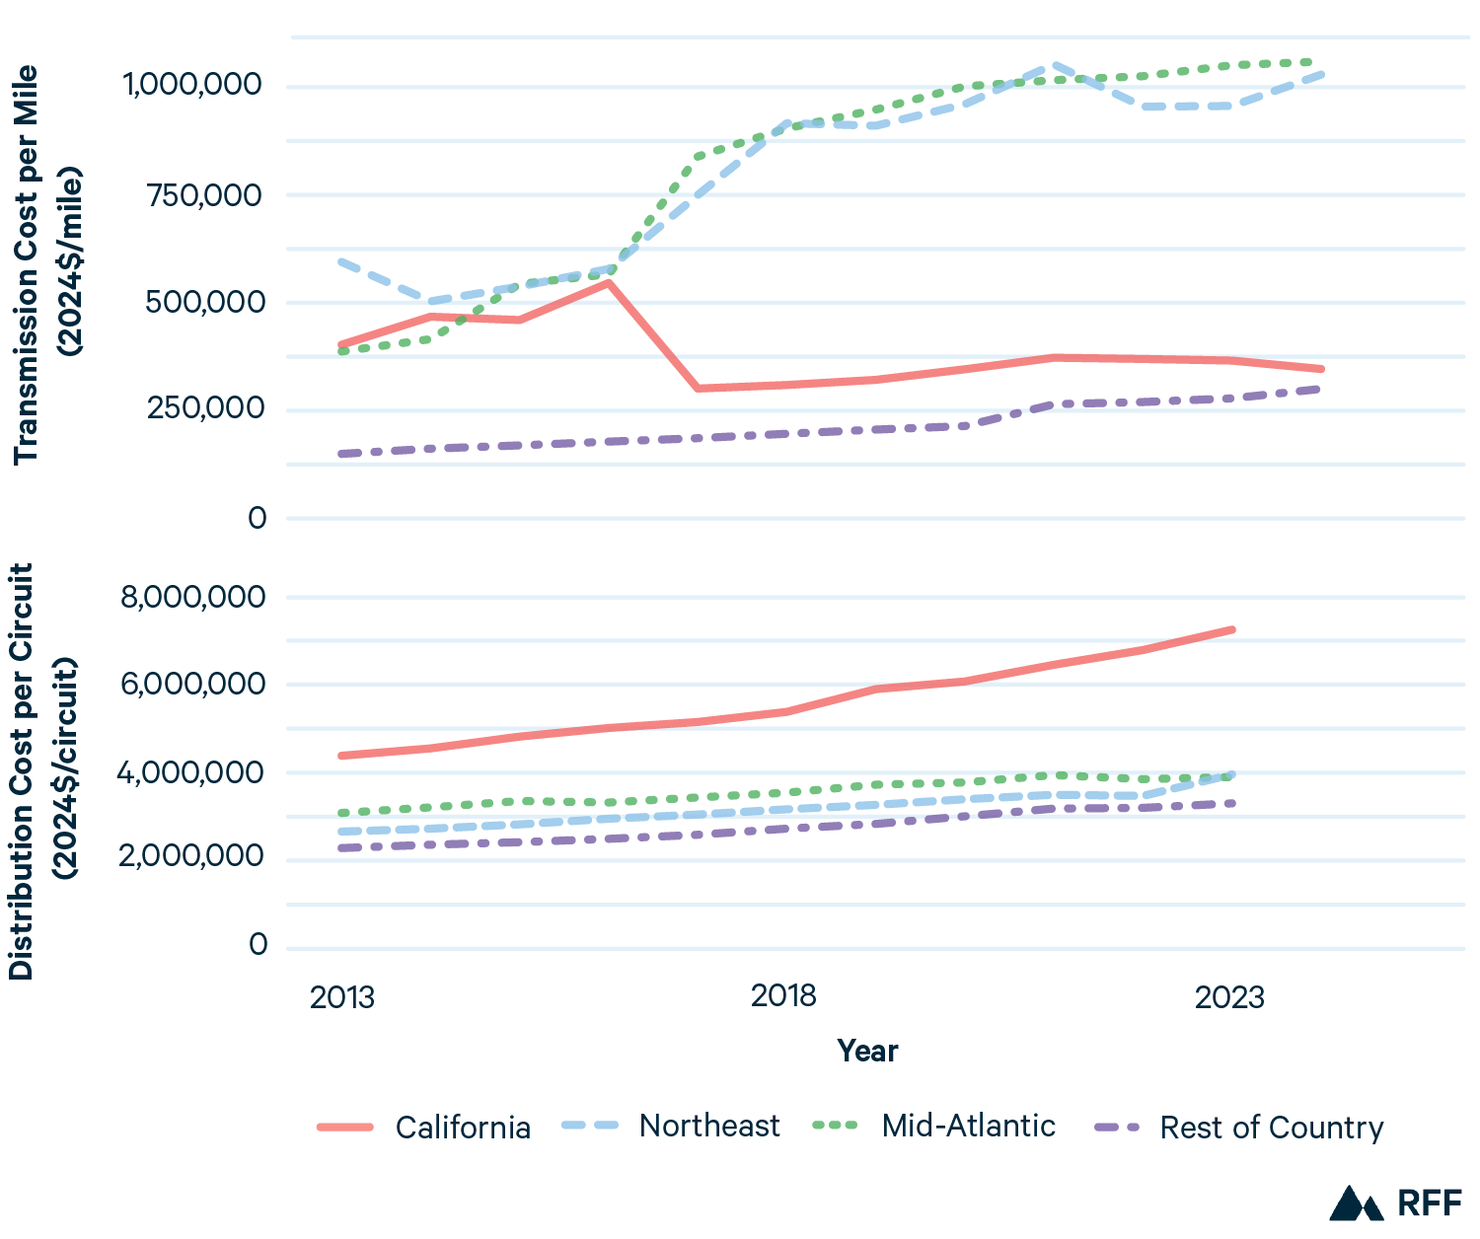
Nationally, inflation-adjusted transmission costs per mile have increased 98.8% since 2013, with especially large increases in the Northeast and Mid-Atlantic. Inflation-adjusted distribution costs per circuit increased 42.5% over the same period, with especially large increases in California. These cost increases come as net growth in transmission miles and distribution circuits has remained roughly unchanged.
Multiple factors could explain these increases in per-unit costs for transmission and distribution. Nationwide, much of the current transmission and distribution infrastructure was built in the 1960s and 1970s and is nearing its end of life. Growing penetration of intermittent renewable resources and generators on customer premises also accelerate the need for upgrades to this aging, twentieth-century infrastructure.
Furthermore, some regions have faced increasing climate risk that has resulted in higher grid costs; for instance, California has invested an enormous amount in upgrading its distribution system to mitigate wildfire risk.
In addition, the cost of siting, permitting, and constructing infrastructure for transmission and distribution may be increasing due to community opposition and local building restrictions.
As a last example, research also suggests that utilities that divested their generation assets as part of electricity restructuring may invest more in transmission and distribution assets to maintain comparable shareholder returns, which is consistent with the trends in Chart 4.
Distinguishing among these and other potential drivers may be a fruitful area for future research.
What’s Next?
Going forward, electricity prices may continue to rise, especially in the Northeast, Mid-Atlantic, and Pacific regions of the United States, for several reasons.
In the near term, recent capacity auctions cleared at high prices in New England and Pennsylvania–New Jersey–Maryland. However, these costs only just started to be included in rates beginning in 2025 and are not reflected in this analysis. Pending extreme rate increases in Florida (Florida Power & Light) and New York (Consolidated Edison) also are not reflected in this analysis.
Nationwide, electricity demand is expected to increase in the coming years as new sources of load, including data centers and electrified transportation and heating, come online. Rapid growth in grid resources will be needed to meet these new sources of demand and maintain reliability; without careful procurement practices, market reform, cost allocation, and rate setting, residential electricity prices could increase in response. In addition, rising distribution costs in California may be a harbinger of future grid costs across the country due to increasing climate change–induced natural disasters and wildfires.
Policymakers may be able to mitigate future electricity price increases and price volatility, protecting the most vulnerable households from high bills. For example, to mitigate grid costs, policymakers can reduce obstacles to building new energy infrastructure, reform markets and procurement practices to attract an efficient portfolio of resources, and support demand-side alternatives like subsidies for rooftop solar and energy efficiency. Beneficial reforms to limit price volatility may include reducing reliance on fossil fuels.
Furthermore, policymakers may be able to soften the impact of rising electricity prices on the most vulnerable households by carefully allocating who pays for new costs on the grid and equitably designing rates and policies. In the short run, direct assistance programs can help customers afford their electricity bills, stay connected to the grid, avoid unsafe heating and cooling practices, and pay for other essential goods and services.
Beyond its implications for pocketbooks and electric bills, electricity affordability is critical for mitigating climate change. The future of power involves electrifying the heating of buildings and operation of vehicles, but realizing this future requires electricity prices to be low enough that millions of households can choose to purchase electric technologies over the existing fossil fuel alternatives. Keeping electricity affordable not only helps households in the present but also improves the climate for future generations.
A version of this article appeared in print in the Fall 2025 issue of Resources magazine.