
For this week’s episode, Miyuki Hino, an associate professor at the University of North Carolina at Chapel Hill, joins host Margaret Walls to discuss Hino’s latest research on high-tide flooding (also called “sunny day flooding” or “nuisance flooding”) in North Carolina. Hino recounts the complications of measuring increasingly frequent and disruptive floods and some innovative solutions to technical challenges—including creating water-level sensors and engaging communities to understand local geographies. By specializing data collection to suit a research area in murky waters, Hino and her research collaborators have noted more accurately the extent to which sea level rise has affected coastal communities. With improved data on hand, Hino reports that previous estimates of flood frequency are serious, but unsurprising, understatements of current realities and that updated findings can help communities better adapt to changing tides.
Listen to the Podcast
Audio edited by Rosario Añon Suarez
Notable Quotes:
- Minor floods can still cause major harm: “The type of flooding [sea level rise is] causing is what we say is disruptive rather than destructive … It’s not exactly the large-scale flooding we tend to associate with hurricanes, but it is still really problematic for people, and it’s becoming more and more frequent because sea levels are rising everywhere.” (4:49)
- Gauging necessary tools: “We were worried about mismeasuring flooding if we just relied on tide gauges. So, we decided to put out our own sensors to focus on what’s happening on land rather than what’s happening in the ocean.” (8:30)
- Significant findings that are not so significant: “So, it’s surprising to us as scientists from afar, but when we’ve shared those numbers with people who are living it, they say, ‘Yeah, that sounds about right.’ That, probably more than anything, was encouraging to us that what we were picking up was real and was a real problem for them.” (20:55)
Top of the Stack
- “Land-based sensors reveal high frequency of coastal flooding” by Miyuki Hino, Katherine Anarde, Tessa Fridell, Ryan McCune, Thomas Thelen, Elizabeth Farquhar, Perri Woodard, and Anthony Whipple
- Sunny Day Flooding Project
- Good Hang with Amy Poehler podcast
The Full Transcript
Margaret Walls: Hello, and welcome to Resources Radio, a weekly podcast from Resources for the Future. I’m your host, Margaret Walls. My guest today is Dr. Miyuki Hino.
Miyuki is an associate professor in the Department of City and Regional Planning and an adjunct associate professor in the Environment, Ecology and Energy Program at the University of North Carolina (UNC) at Chapel Hill. Miyuki’s research investigates the linkages between natural hazards, governance, and public policy to drive effective and equitable climate adaptation. She’s with us today to talk about a really interesting project she has that involves installing land-based sensors along the North Carolina coast to measure high-tide flooding.
She’s recently published a paper that’s written with several coauthors in the journal Nature Communications Earth & Environment that’s entitled “Land-Based Sensors: Reveal High Frequency of Coastal Flooding.” That paper describes some of the findings that she and her team are getting from these sensors, and we’re going to hear about that paper and some of her other ongoing research in today’s show, so stay with us.
Hello, Miyuki. Welcome to Resources Radio. Thanks so much for coming on the show.
Miyuki Hino: Thank you for having me.
Margaret Walls: So, Miyuki, we always start the show with get-to-know-you questions, so I want to ask a little bit about you. How did you come to work on environmental issues, natural hazards, and climate adaptation? What’s been your path?
Miyuki Hino: Well, as I’m sure is the case with many other people, there was a lot of chance involved. I graduated from college with a degree in chemical engineering and a vague interest in sustainability, but I really had no idea what to do next. And then I applied to a lot of jobs and didn’t get them. And then I finally got a job as a research assistant with a civil engineer who was working on a project looking at how to design levies when future flood risk is uncertain. I really took to the core question of, “How do you plan when you know the future is not going to look like the past, but you don’t know what the future will look like?”
I just thought that there’s so many ways in which our world is built on and understanding that the past is a good guide to the future, and it poses so many challenges when you can no longer use the past as a guide for the future. When you add human nature and behavior onto that, it makes planning so much more difficult. We’re shortsighted. We underestimate the probability of bad things happening. We really care about what happens tomorrow. We care a lot less about what happens in 10 years or 30 years or 50 years.
To actually continue thriving into the long term, collectively as societies, we have to try to overcome those biases and make informed choices. That problem really became something that I was intellectually interested in and kind of stuck with me all the way through graduate school.
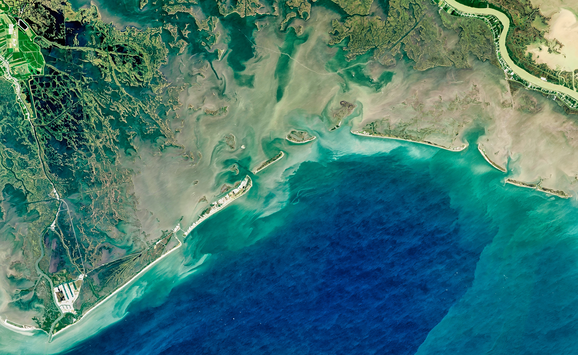
Margaret Walls: Yeah, that’s interesting. Thanks for sharing that. I want to talk about the problems now that motivated this research project we’re going to talk about. So, so-called nuisance flooding or sunny day flooding or minor high-tide flooding—and I’ve heard all these terms get used—is getting worse because of sea level rise. Tell us about these problems—what they look like, how they’re affecting communities. Just kind of paint a picture for us, if you will.
Miyuki Hino: Sure. So, you can think of really any coastal town or city in the United States and think about the infrastructure along the coast, the roads, the drainage systems, the water pipes. Those were designed decades, maybe centuries ago, and when they were designed, water levels were probably about a foot lower.
Now those average water levels, because of climate change, are about a foot higher. You can have really just routine fluctuations in water level.The tides are higher at some times of the year. You can have wind blowing in a certain direction that pushes up the water level. Those slightly higher-than-normal water levels were fine a hundred years ago, but now they’re happening on water levels that are a foot higher to begin with and they’re causing flooding when they didn’t before.
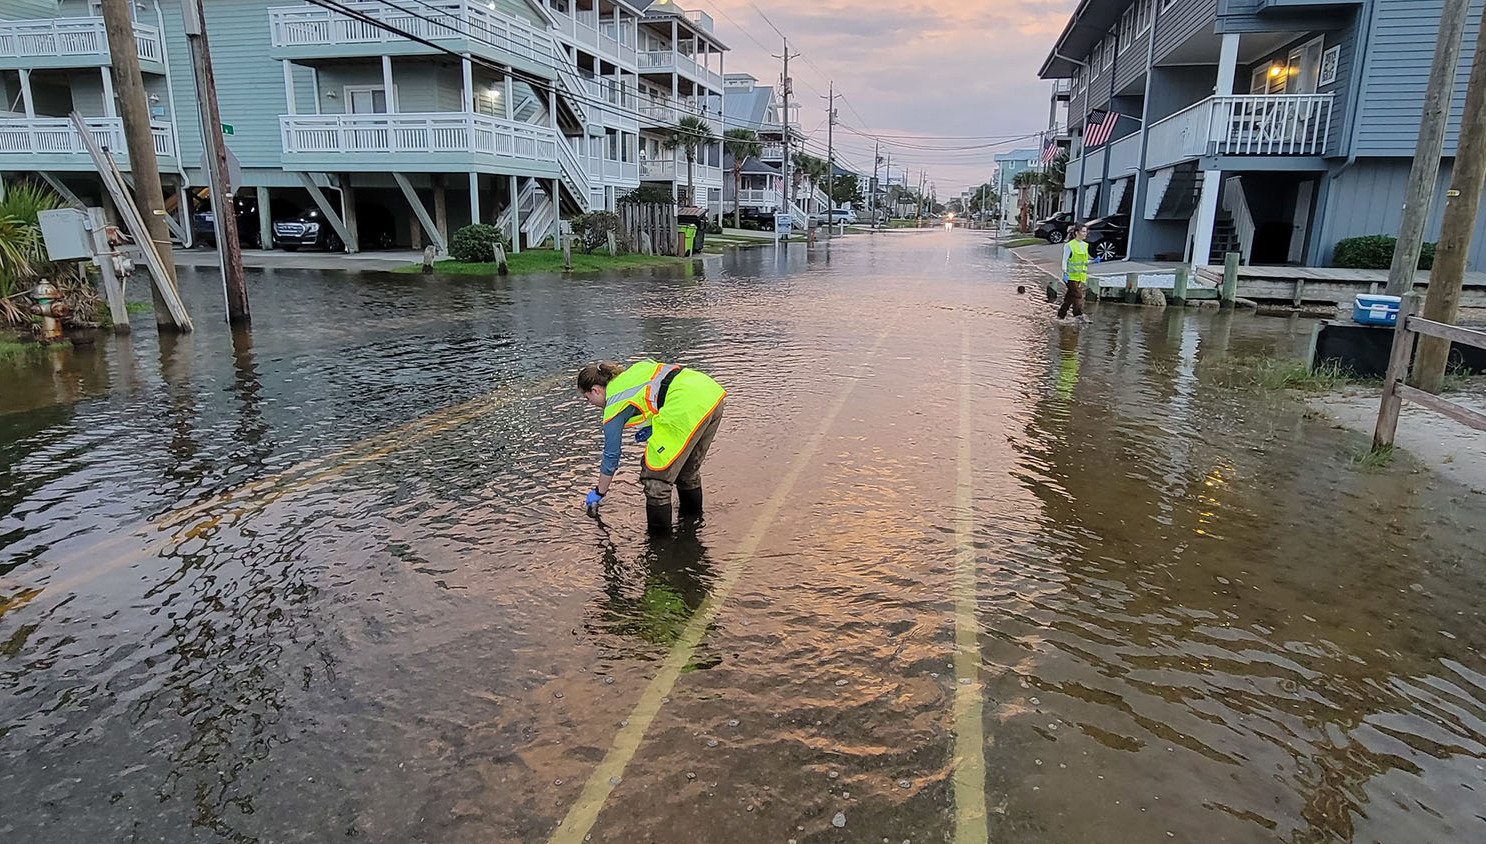
The type of flooding they’re causing is what we say is disruptive rather than destructive. It’s really not that eye-catching … what you see in the news when a hurricane comes through of a massive storm surge wiping out a bunch of buildings. This type of flooding causes more roads to become impassable. Cars and garages often get flooded. School buses can’t get to certain neighborhoods. People either can’t make it to their jobs or they can’t get to their jobs on time. It’s not exactly the large-scale flooding we tend to associate with hurricanes, but it is still really problematic for people, and it’s becoming more and more frequent because sea levels are rising everywhere.
Margaret Walls: Yeah. Right. My own opinion, honestly, as a researcher, is that there’s less study of this problem than there should be. We tend to focus on the big events, but not so much on this, and it is a problem that’s getting worse. So, that made me really excited about your project actually.
I want to talk about tide gauges for a minute. The federal government operates a system of tide gauges up and down the coast. Most of them, I think, are operated by the National Oceanic and Atmospheric Administration (NOAA). Just tell us a little bit about what these gauges are used for and why you didn’t decide to rely on the data from them for your study. Instead, you went and set up your own sensors.
Miyuki Hino: Tide gauges are a really excellent measure of what’s going on in the ocean. They’re very reliable at telling us how high the water levels are in the ocean and the contribution of tides, wind, and how much storm surge is occurring. Tide gauges are excellent at that and they’ve actually been a really critical tool for us to understand sea level rise globally. This is not at all about the quality of the data we’re getting from tide gauges at all. The thing is, that for our project, we’re interested in water on land, where it affects people’s lives. Tide gauges don’t actually measure water on land. They measure water in the ocean or in the bay.
What’s happening on land can be really different from what’s happening in the ocean, partially because of rain and maybe also because of groundwater. You have drainage systems that move water around in potentially unpredictable ways. We had this suspicion that the tide gauges can tell us what’s happening if the water is only coming from the ocean, but what about flooding that comes from other sources or what about a combination of sources? How much flooding are we missing if we’re only looking at what’s happening at the tide gauges? We were concerned that we weren’t really measuring what people were experiencing if we relied just on tide gauges.
The other issue with tide gauges is there aren’t all that many of them. In North Carolina, there are four up and down the coast and some places that are farther from tide gauges, they may experience water levels that are really different from what’s at the tide gauge.
So, you have two challenges. One is that the tide gauge might not even be a great measure of the ocean water level where you are. Second, the flooding where you are can also be influenced by these non-ocean things like rain and groundwater. We were worried about mismeasuring flooding if we just relied on tide gauges. So, we decided to put out our own sensors to focus on what’s happening on land rather than what’s happening in the ocean.
Margaret Walls: Yeah. Fair enough. There’s not very many of them. Just to segue for a minute, do you know why we don’t have that many? I know if you look at the system, there’s just not that many. You said that in North Carolina, there are four along the coast. I mean, that’s kind of typical. Do you have any idea why that is—why we don’t have more? Is it a big deal to put them out there, or what?
Miyuki Hino: There are a lot of new efforts to put out more in different places and in North Carolina. Actually, the state has a network of gauges that they operate as well. Depending on where you are, there might be a non-NOAA gauge that is closer to where you are, but I expect that it has to do with the costs and human time required for maintenance and data cleaning and data quality assurance. Our sensors run differently than tide gauges do and potentially run in a way that makes it a little bit more intense from a maintenance perspective.
I know, from having talked to other people, that putting out gauges and so forth can take a long time just to get a gauge to a place where you’re confident in the reliability of the data, and then it takes some amount of consistent checking-in and upkeep to make sure it’s still giving you data you want consistently over time. So, that might have something to do with it.
Margaret Walls: Oh, that’s interesting. Well, tell us about your sensors that you did. Where did you put them? How did you decide where to put them? Just tell us how they work. Tell us a little bit about them.
Miyuki Hino: Yeah, how they work. That’s a really good question. For a variety of reasons, we ended up deciding to design and build our own sensors. I should say that when I say we, I really mean that I somehow convinced my collaborator, Katherine Anarde, who’s a coastal engineering professor at North Carolina State University, to design and build a sensor that could do this. So, I had very little to do with the designing, but I got to ... It was a lot of fun working together on it, and it’s been a really rewarding collaboration so far.
Our sensors have two parts. One part is a pressure sensor that actually sits inside a storm drain. If you walk along the street, there are often these iron grates that go down into a pipe system and the rain flows out into that pipe system, and then it goes out to a creek or a river or the ocean. What we knew, in some towns, is that the flooding was coming through the stormwater drainage system. So, the ocean was flowing backward into the pipes and then up out of the grate onto the road.
We wanted to measure the water levels inside the storm drain because then we could not only see what’s happening when there’s water on the road, but we could also see a bunch of near misses. We could see times when there was water flowing into the stormwater drainage system, even if it didn’t quite get onto the road.
Our pressure sensor was designed to … We strap it to the top of the grate and it hangs down inside. If there’s no drainage infrastructure like a pipe system, we can mount it to kind of sit over a drainage ditch on the side of the road. As soon as that sensor gets wet, it tells us how deep the water is. As the water gets deeper above the sensor, it is transmitting more and more pressure, and we can convert that into a water level. That’s one part, so that’s our water-level data.
Our second part is a camera. We mount the camera to a pole or to a tree nearby and it takes pictures every six minutes. In that camera box, we’ve got some communications hardware. The water-level data and the pictures get relayed to our website in real time, which is really helpful not only for immediate, real-time communication of flood risk so people can check if they can get home (for example, what does the road condition look like right now), but it was also helpful for us to make sure that our sensors and cameras are working consistently to get that real-time feedback.
In terms of where we put them … When we first started, we asked a lot of our colleagues and friends on the coast to point us to where it floods a lot. We just said, “Where should we start? We’re really interested in this problem. What places come to mind when you think of this problem?” and they pointed us to this small town called Beaufort. It’s got a low-lying main street right along the coast, and we started there. It was conveniently very close to UNC’s marine lab, so our lead engineer could get there pretty easily, which was a big deal in terms of troubleshooting and figuring out what was going on. We were seeing pretty regular flooding there.
But, throughout this whole time, Katherine and I were also spending a lot of time just trying to connect with local government staff and community members along the coast to understand who else was experiencing this problem and what it looked like for them. We spent a couple of days just driving from one town to another and meeting with folks who could tell us about what was going on there and whether they might be able to use these sensors.
The next two places that we went to were both places where someone there said, “Hey, we have this problem,” and they gave us a flood tour. So, that’s how we start. We walk around or drive around with them through their community and they point out to us all the different trouble spots they have and what they think is going on in town.
Ultimately, we pick a place that we think is pretty close to the first place that floods within the community. That’s because it’s a good first indication of where flooding might be occurring. We could have put it somewhere that was rarer, but then the people who really care about that most flood-prone spot wouldn’t get the information they needed.
When possible, we put it as close as we could to the big trouble spots in town. That was constrained a little bit by the technology (we needed a reliable cell phone signal, for example, which is not always the case in some of the areas where we work), but generally these were community-driven choices—a place where people would want to see the pictures and get the data, and also a place that they knew was flooding a lot.
Margaret Walls: So, are they in the storm drains and all? There’s three locations, right? In the study, you talk about three locations. Are they always in the storm drains, or are they different?
Miyuki Hino: They’re different. Now we have 10 sensors up. Some of them are clustered in certain communities. In one of the towns where we work, Carolina Beach, we have three. We have two in New Bern, which actually is not in the paper because it’s much less tidally influenced—it’s farther up in the estuary. We have one in Beaufort, which is where we started, and then we have four in an area called Down East Carteret County (Down East), a set of rural communities out on a peninsula in central North Carolina. They’re a mix of, let’s see, about six of them are in storm drains. The ones Down East are generally on the sides of roads sitting over ditches because they don’t have a storm drain system out there.
Margaret Walls: Yeah. Okay. Well, tell us what you found, Miyuki. What did the sensors tell you?
Miyuki Hino: They told us that roads are flooding a lot and a lot more than we previously knew. So, for our three sites, we looked at the data for a one-year time period from 2023 to 2024. Across our three main sites in Beaufort, Carolina Beach, and Down East, roads flooded on 26, 65, and 128 days over the course of that year.
Margaret Walls: 128, wow.
Miyuki Hino: Yeah, 128 days. So, one out of every three days, there was water on the road. A handful of those days were associated with extreme storms. We had a few tropical storms either come through or come along the coast, but even if you remove those days, it’s 20, 60, and 122 days. It’s a lot of flooding, no matter how you slice it.
The other thing to note about those numbers is that we count any amount of flooding on the road as a flood, so we don’t have a specific depth threshold. It could have been an inch of water on the road or it could have been two feet. Those both count as a day. We do that because, one, I think any threshold would be a little bit arbitrary.
But two, in most of these situations, it’s saltwater. You can have small amounts of saltwater on the road and driving through it is going to really cause big corrosion problems to your car. It made sense to us that it didn’t have to be so deep to flood out your car to be a problem.
So, it was flooding more than we knew.It was a lot more than we had previously suspected. The reason is because, as I said at the beginning, the main tool we had to estimate coastal-flood frequency was our tide gauges. Typically, what folks have done is, at a given tide gauge, there’s a certain water-level threshold. NOAA calls their threshold the high-tide flood thresholds, which is probably the one that’s most commonly known. The National Weather Service has one, as well. Whenever the water goes above that threshold, they call that a flood day. So, that was our best guess of how often flooding was occurring.
Over our time period, in Beaufort, we had 20-ish days of flooding; at sea level, we had over 120 days of flooding. NOAA had 9 days of high-tide flooding. In Carolina Beach where we had 60, they had 1. So, these were much higher numbers than we had expected to see based on the tide-gauge-based proxies that we had available to us before.
Margaret Walls: That’s super interesting. If you told the community that there was 120 days (or the one that had 120, I forget which one that was), did you ground truth that? Did they go, “Oh yeah, that makes sense. We did have water on the roads that often,” or anything like that? Did you talk to people once you got the readings?
Miyuki Hino: Absolutely. We were talking to people … Well, as I said, we talked to people before we even started, and we continued throughout to do a lot of community engagement in different forms so that people are aware that the cameras and the data are available online in real time for their own safety and for deciding how and when to travel. But, what’s really interesting is—in all of these communities, we present at town councils pretty much every year—when we’ve gone to community events and shared this information, I don’t think a single person has been surprised.
So, it’s surprising to us as scientists from afar, but when we’ve shared those numbers with people who are living it, they say, “Yeah, that sounds about right.” That, probably more than anything, was encouraging to us that what we were picking up was real and was a real problem for them.
Margaret Walls: Yeah. So, you’re describing the frequency of flooding—how many days. Let me ask you about other aspects of it. The duration of flooding is one thing, and you talk about that in the paper. I also want to know if you got anything on the spatial extent or the area of inundation—is that a part of what you looked at? Then, just lastly, you said if there’s any amount of water that’s flooding, that’s counted, so did you look at differences in how much there was?
Miyuki Hino: In terms of duration, it’s different from place to place, but generally speaking, the duration that the tide gauge is above that high-tide flood threshold; it’s often a shorter duration than the duration that we see water on land.
One potential reason for that is, especially in rural areas, the speed of water retreating off of land and into the bay is probably slower than how quickly the water level can change at the tide gauge. Essentially, the tide can go out quicker in open water than how long it takes for the water to actually move across land over really shallow gradients and actually dry out. So, even for duration, the tide gauges were not providing reliable data on how long these places were underwater.
Spatial extent is a tricky one. What we are actually in the middle of right now is a project that uses our sensor and our camera images as ground-truth data to estimate flooding extents from satellite data, because we understand that, first of all, this flooding is disruptive to people and it’s becoming a bigger problem very quickly. Second, it is hyperlocal. It can be so different across small geographies where, block to block, you can have hugely different experiences and that’s not totally predictable from elevation alone, especially when you have underground pipes that are moving water around, or if you have rain and tide combining in different ways, the spatial extent of the flood is maybe not what you would’ve thought it would be.
So, we’re working on that now, and an added challenge with that is that most of these floods are not very long. If it’s being caused by unusually high tide, it might be flooded for four hours when the tide is high and then drop back out as the tide recedes. If it’s caused by a combination of tides and rain, it might be even shorter because those rainfall events could be an hour long. So, it’s tough to capture the spatial extent of events that are so ephemeral in nature, but we’re hopeful that this will at least give us a better sense of true frequencies across the geographies where we work.
Margaret Walls: Yeah. So I wanted to ask you about the many benefits from measuring these water levels on land rather than relying on the tide gauges, but we have this long-standing network of tide gauges. I’m wondering: Where do we go from here? Do we need to set up these kinds of sensors that you did everywhere or is there some way to use the tide-gauge data and adjust it or something like that? What do you think about that? What are the implications of your findings for the tide-gauge data?
Miyuki Hino: First, I think it’s important to emphasize again that the tide-gauge data are great. We use the tide-gauge data all the time, and they’re excellent at doing what they were designed to do. They just weren’t designed to capture this type of flooding because, frankly, when most of them were installed, this type of flooding wasn’t happening.
But, where do we go from here is a really good question. There are efforts in a couple of different areas to think about how to fill in the gaps between tide gauges. NOAA, along with other researchers here at UNC, actually have led efforts to estimate water levels along the entire US coastline every hour for years at a time, so that we’re not just relying on what’s happening at the tide gauge, no matter how far apart those tide gauges are. There are also—like I said, not just the effort we’re putting forward with satellite data—there are other satellites that can help us get at this as well.
There’s a relatively new NASA satellite project called SWOT, or Surface Water and Ocean Topography, which captures water levels across the globe, all along the coasts, and that can also highlight some of these spatial differences to help us, like I said, fill in the gaps between tide gauges in terms of what’s happening in the ocean. When it comes to what’s happening on land and how land-based drivers of flooding, like rain and infrastructure, interact with what’s happening in the ocean—that is a much trickier problem and is very context dependent. The interactions that we see in our small towns that have drainage systems and infrastructure are much more developed than the rural areas. Those interact when it comes to rains and tides in a very different way.
So, I don’t necessarily think the answer is all of these sensors everywhere, though I will say we have all of our documentation for how to build them posted online—it’s open source and it’s not very expensive. I encourage you to build them and put them where you live. But I do think that thinking about more affordable ways to understand where this problem is really severe is important because it can help us direct our energy in terms of how we’re going to respond and where we’re going to invest in different adaptation measures to combat this type of flooding.
Margaret Walls: Right. Okay. Fair enough. That’s really good, and I want to encourage people to go to your website. We’ll put a link on our page when we post the podcast recording, but it’s called the Sunny Day Flooding Project.
You guys have a lot of other things going on. I don’t know if you want to take a quick minute to say what else you guys are doing in the project now?
Miyuki Hino: Sure. So, I mentioned the satellite-based estimate of flood extent—that’s one big thing we’re working on. We have done a lot of social science and community-engaged work as well.
In two of our communities, we are doing or have done a series of community workshops to develop and test potential responses to the flooding. We can build flood models for these different areas and calibrate the flood models using our sensor data so that we know that we can recreate the events that they’re experiencing and do a good job modeling and simulating the flooding that they’re experiencing. Then, we can use those models to test things like, “What if you built a seawall here?” or “What if you elevated this section of roadway?” or “What if you created a drainage canal in this area?”
In our community workshops, we bring residents together to brainstorm what types of solutions they’re interested in. We model them, bring the information back to the community, and they might refine their ideas a little bit more about what they want to pursue or what they’re interested in based on the results.
We also talk about how those options perform under future sea levels. We model that, as well, and different elements of feasibility or other considerations like, “How might it affect the ecosystem locally? How might it affect tourism activity or waterway access?” So, those community workshops help us take the data that we’re collecting and really help communities move toward doing something about it.
We’re also, through Dr. Natalie Nelson and Dr. Angela Harris, who are both at North Carolina State University, doing water-quality testing to understand the potential health impacts of these floods. They still have a lot of work that is in the process of being published, but certainly the early findings are that the floods mobilize a lot of contaminants that are dangerous to human health.
These are not like hurricane floods that people try to stay out of. These can look like a water-main break or they can look like a big puddle. It’s actually quite dangerous because people do come in contact with these floods regularly. They walk their dogs through them, for example, and kids go and splash in them. Another branch of our work is understanding the health threats and working with communities to encourage more protective behaviors from people who might encounter them.
Margaret Walls: Yeah, that’s great. I love the interdisciplinary nature of this project, Miyuki, and also the community engagement. That’s great.
Well, we’re out of time and we have to close the podcast now with our regular feature that we call Top of the Stack. That’s where we ask our guests to recommend something to listeners— a book, an article, a podcast, anything. So, Miyuki, what’s on the top of your stack?
Miyuki Hino: Right now, I have been listening to Amy Poehler’s new podcast called Good Hang. It is totally unrelated to everything—climate change or politics or anything else—but it’s been a really great escape.
Margaret Walls: Nice. Yeah. I love her. She’s the best. All right. Well, thank you for that recommendation.
Miyuki, it’s been a pleasure having you on Resources Radio, talking about your fascinating research on coastal flooding and sea level rise. I know you have so many other interesting research projects going on, so thanks so much for taking the time to come on the show.
Miyuki Hino: Thanks so much for having me.
Margaret Walls: You’ve been listening to Resources Radio, a podcast from Resources for the Future. If you have a minute, we’d really appreciate you leaving us a rating or comment on your podcast platform of choice. Also, feel free to send us your suggestions for future episodes.
This podcast is made possible with the generous financial support of our listeners. You can help us continue producing these kinds of discussions on the topics that you care about by making a donation to Resources for the Future online at rff.org/donate.
RFF is an independent, nonprofit research institution in Washington, DC. Our mission is to improve environmental energy and natural resource decisions through impartial economic research and policy engagement.
The views expressed on this podcast are solely those of the podcast guests and may differ from those of RFF experts, its officers, or its directors. RFF does not take positions on specific legislative proposals.
Resources Radio is produced by Elizabeth Wason, with music by Daniel Raimi. Join us next week for another episode.