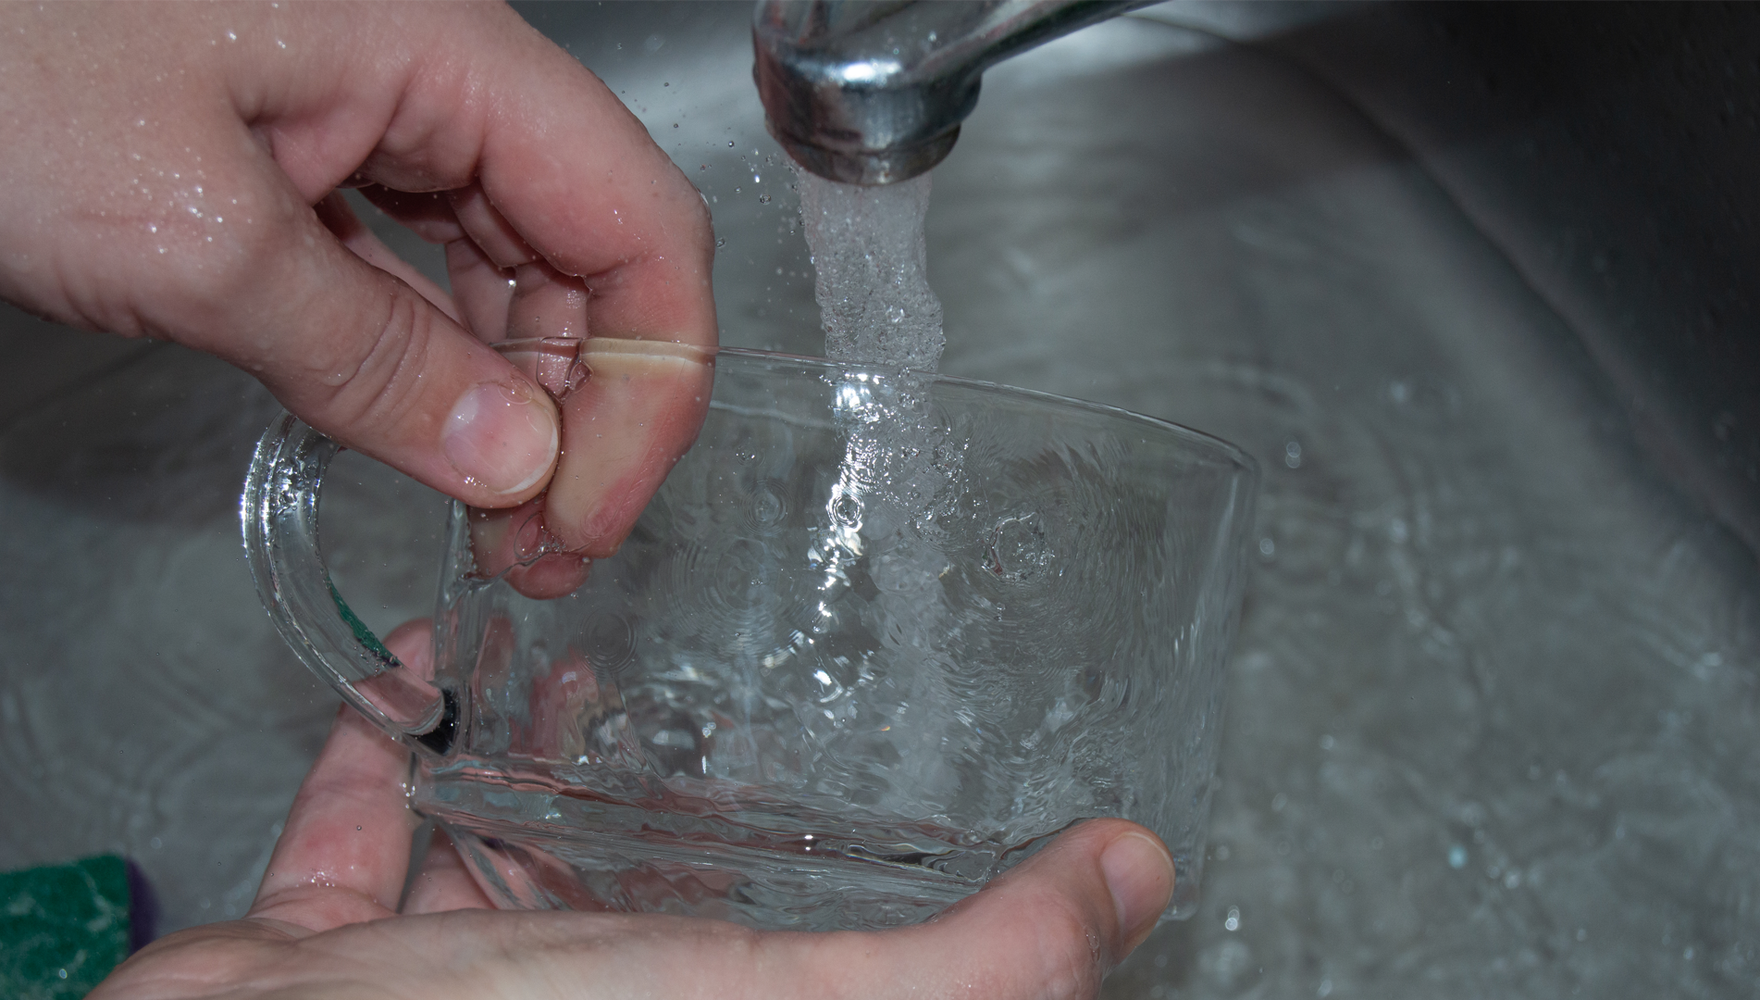


In this episode, host Margaret Walls speaks to Dave Keiser and Joseph Shapiro about safe drinking water in the United States. Keiser is a professor at Yale University, and Shapiro is an associate professor at the University of California, Berkeley. Together with other coauthors, they put out a research paper on clean drinking water: how US residents have access to it, what types of policies help preserve it, and the degree to which it benefits people’s health. Their paper incorporates more than 250 million readings on 1,250 different water pollutants across 48 states over several decades, links those data to maps of public water systems across the country, and connects all this information to health outcomes via Medicare data. The Safe Drinking Water Act of 1974 authorizes the US Environmental Protection Agency to set limits on contaminants in water supplied by public water systems, and the act provides financial loans to local municipalities for constructing and upgrading wastewater-treatment plants; this law led to major improvements in providing clean drinking water to US residents. Some of the questions Keiser and Shapiro address in this episode: What exactly are the benefits of access to clean water—and do those benefits justify the costs? What level of government is most effective for managing drinking water? Find out more by listening to the episode.
Listen to the Podcast
Audio edited by Rosario Añon Suarez
Notable Quotes
- Government loan programs help keep water clean: “We find that these loans are really effective at reducing pollution. The average loan reduces the share of readings above health standards by about 9 percent … We look at how far out these improvements last, and we can see that they last for at least 10 years. So that’s on the pollution side of things: these loans are effective.” —Dave Keiser (12:07)
- The human need for water in the historical record: “I think of drinking water and health as one of the classic questions in environmental health. Some of the technologies that were created through the investments Dave was describing had been around since early human writing—like, they’re described in the Bible and in tombs of Egyptian pharaohs. And early investment in drinking water in the early 1900s, through filtration and disinfection, is sometimes considered one of the most cost-effective investments to improve health in the twentieth century.” —Joseph Shapiro (13:35)
- Ingesting affects the body: “US industry produces or processes over 30,000 different chemicals. The Safe Drinking Water Act regulates 90. We have data on over 1,000. And if you list the different systems in the human body which can be harmed by the organic chemicals, inorganic chemicals, disinfection byproducts, radioactive compounds—it’s almost every system in the human body.” —Joseph Shapiro (18:19)
- What’s next for water: “I think the data will help open up new questions about how we can better manage our water systems and the fiscal consequences of those management decisions.” —Dave Keiser (24:37)
Top of the Stack
- “Water Works: Causes and Consequences of Safe Drinking Water in America” by David A. Keiser, Bhashkar Mazumder, David Molitor, and Joseph S. Shapiro
- “National trends in drinking water quality violations” by Maura Allaire, Haowei Wu, and Upmanu Lall
- “The Evolution of Water Pollution Control in the United States” by William L. Andreen
- The Lost City of the Monkey God by Douglas Preston
The Full Transcript
Margaret Walls: Hello, and welcome to Resources Radio, a weekly podcast from Resources for the Future. I’m your host, Margaret Walls. Today on the show, we’re going to talk about drinking water in the United States and why you might have turned on your tap this morning and had a drink, without worrying about whether the water was safe.
My guests are David Keiser and Joseph Shapiro. Dave is professor of water policy and management at the Yale School of the Environment, and Joe is Chancellor’s Associate Professor in the Department of Agricultural and Resource Economics and the Department of Economics at the University of California Berkeley.
Joe and Dave are coauthors, along with Bhash Mazumder and David Molitor, of an important new paper. I think it’s a great paper. It’s entitled, Waterworks: Causes and Consequences of Safe Drinking Water in America, which has been conditionally accepted in the Quarterly Journal of Economics.
So, I told Dave after I read this paper, I feel like it’s a real tour de force. The authors spent many years collecting a massive amount of data that had not previously been assembled, 266 million readings on 1,250 pollutants over several decades across 48 states. They gathered the data through a whole host of methods, Freedom of Information Act requests, scraping of websites, reaching out to various state-agency staff. They linked the data to drinking water service territory maps for 150,000 public water systems across the United States. There’s a lot of individual systems, in case you didn’t know that. And then, they match all this to Medicare administrative data on health outcomes, and they address a number of different questions in the paper, which I’m going to ask Dave and Joe to talk about today.
We’ll then leave a little time at the end to discuss some current US drinking-water policy issues. Lots to talk about, so please stay with us.
Dave Kaiser and Joe Shapiro, welcome to Resources Radio. Thanks so much for coming on the show.
Dave Keiser: Thanks for having us.
Joseph Shapiro: Thanks for having us. Excited to be here.
Margaret Walls: Well, you guys, we always start with the get-to-know-you question. I want to hear a little bit about how you got into what you’re doing—what inspired you to become environmental economists and work on water issues. Dave, can I start with you?
Dave Keiser: Yeah, that sounds great. Thanks, Margaret.
So, I’d say my environmental econ journey started shortly after college, when I was working at a small consulting firm in DC, and that firm focused on recovering commercial insurance assets to pay for environmental and asbestos liabilities. I didn’t have a background in economics, but became really fascinated by the work that the main economist did at the firm.
So, after a few years there, I went back to school for a master’s in Agricultural and Applied Economics at the University of Georgia. While there, I took a class by Jeff Mullen, who taught a course on water economics. It hooked me. I realized that’s what I wanted to study.
So I then moved to the Yale School of Forestry and Environmental Studies, where I did my PhD in Environmental and Natural Resource Economics, and focused on water pollution issues.
Fun fact for your audience: As it turns out, in my last year of graduate school, I was fortunate to meet a pretty fantastic new assistant professor, and that professor’s name happened to be Joe Shapiro. I learned a lot from Joe. It was a great time. And here I am, 12 years later, still working on water pollution issues.
Margaret Walls: How about you, Joe? What’s your story?
Joseph Shapiro: I mainly grew up in Oregon, where spotted owl versus timber jobs and dam removal were in the news a lot. So I think that put a lot of environmental econ questions on my radar. And then, as an undergrad, I took an environmental econ class with Larry Goulder, so that exposed me a bit to the field.
In grad school, I had a range of interests. I took a class in the field with Michael Greenstone, but I also downloaded syllabi from a lot of other environmental econ classes to get a sense of what the field was about. And I noticed pretty quickly there was a very high concentration of papers on climate change and air pollution, and then stunning silence about the Clean Water Act and water pollution. That seemed like a hole that would be good to address.
And a fun addition to Dave’s fun fact: My recollection, which Dave may or may not be able to corroborate, is that we had talked about water pollution a couple times. And then one morning, we both had toddlers who ended up at East Rock Playground and had an hour standing around while they were climbing on structures. And that was kind of the beginning of, “Hey, wouldn’t this be great to work on together?”
Margaret Walls: Yeah. Oh, nice. I like that. Yeah, that’s good. Okay. Well, let’s turn to this paper.
So, one of the top-line findings in it is that the share of pollution readings that are violating health standards for drinking water fell by half over the period of your data, which is 2003 to 2019.
But I also noted: In the introduction of the paper, you say prior work that uses federally reported violations data showed something like the opposite trend. So can you both just talk about, first of all, this basic finding and the trends.
And then, why does this concentration data that I described at the beginning, which you so carefully collected, tell a different story than the violations data? Dave, do you want to tell us a little bit about that?
Dave Keiser: Yeah, great questions, Margaret. I will certainly make sure we get to both of those, so please pull me back if we don’t, but I think it might be helpful just to provide a little bit of background here.
The Safe Drinking Water Act is the main federal statute—so the main law that governs drinking water quality in this country. It was passed back in the early 1970s, in 1974, and that law authorizes the US Environmental Protection Agency (EPA) to set limits on contaminants in water supplied by public water systems. So that’s where most Americans are getting their water.
And so, these public water systems are responsible for treating, as well as testing, the water they provide to households and businesses. They then generally report those results to a state agency that oversees them, and then that state agency reports violations of those limits to EPA. And thus, EPA, the main federal agency that oversees the Safe Drinking Water Act, their main federal compliance database contains mostly information on violations; it also contains information on the water systems and enforcement; but what it doesn’t contain, necessarily, is a comprehensive record of the underlying water-pollution readings.
So, I believe there are really two main points here to make. First is that we wanted to look at that comprehensive record. We wanted to look at the full distribution of measured drinking-water concentrations—not only what happens when you exceed a standard, but what are those levels that are below standards? What that meant was we had to collect the data ourselves. And as you mentioned, this was a pretty extensive effort, and we did this by contacting individual states for the data, through a pretty large effort over many years.
So, the second key point to make here is that, after we got the data, we then wanted to understand what the data shows. And the reason why we wanted to look at the pollution concentrations, rather than violations, is that violations can depend on a number of different things: how much pollution is present, what a particular drinking-water rule requires, and whether or not that violation is actually reported. And so, tighter standards or new requirements over time can produce more violations, even when the water, say, might be getting cleaner.
So, we collected these underlying readings so that we could then compare changes in water quality against the same numerical benchmarks over time. And that gives us a pretty consistent, then, measure of changes in pollution.
Getting to some other work on violations, there’s been really important work done. There’s a paper that I think is really fantastic by Allaire, Wu, and Lall. It’s published in the Proceedings of the National Academy of Sciences, and they look at this question about how violations of drinking-water standards have changed over time. And they generally find that violations have increased over time. There’s some that go up, some that go down, but generally the pattern is increasing violations over time.
But that might not be too surprising, because new rules have been passed, and after a new rule is passed, you might see increasing violations.
And so, our data lets us ask a different question, and that question is, How did pollution change when measured against these same benchmarks over time? And when we ask that question with our data, we find that the share of readings above a fixed health standard falls by about half from 2003 to 2019—from about 2.5 percent of readings that violate standards, to just a little over 1 percent. And that’s a substantial improvement and something we probably would’ve missed just by looking at violations.
Margaret Walls: Yeah. Gotcha. And so, it’s a positive story, which is good, I think.
Dave Keiser: Absolutely.
Margaret Walls: So, let’s talk about some of the factors that might have led to that. One of the things you analyze in the paper is the effectiveness, and the cost-effectiveness, of loans that are made through the Drinking Water State Revolving Fund program. And I’ll just provide the quick background on that.
It’s been around since 1996, and the basic way it works is that EPA makes grants to states, and then the states turn around and use that money to make low-interest loans and other financial arrangements to drinking-water providers for doing infrastructure upgrades and so forth.
So, Congress appropriates the money for the program and (I looked this up) a total of $41 billion has been invested, $21 billion from the federal government. The rest comes from state matches and then kind of recapitalizing the fund over time. And there’s been, from what I read online, 15,425 individual loans and other financial arrangements that have been made.
So, this has been a big program for a number of years. So, tell us: Dave, I’ll start with you. What did you all do when you were analyzing this program? What was the approach in the paper?
Dave Keiser: Yeah, sure. Thanks Margaret. And I mean, it’s a lot of money, right? But let me start first with just a little bit of background, because I think that’s helpful to understand these loans.
So, if we think about our broader water-infrastructure funding in this country, I like to think that we have two broad buckets of that funding. So, one bucket is concerned with surface-water pollution—pollution that enters into rivers, lakes, and streams. You can think of that as our “Clean Water Act bucket,” and it funds construction and upgrade of municipal wastewater treatment plants. That’s something that Joe and I have studied in other work.
But another bucket that we’re going to talk about today is a bucket of money that concerns drinking water, and you can think of that as our “Safe Drinking Water Act bucket.” And that bucket funds the construction and upgrade of municipal wastewater-treatment plants.
Historically, the federal government spent considerably more on these Clean Water Act investments through the ‘70s and ‘80s, but the passage of the 1996 amendments that you mentioned really changed the money that the federal government was providing for spending on drinking-water issues, and significantly increased that funding.
So, we wanted to ask, How effective have these loans been at improving both drinking-water quality as well as human health? To do that, we obtained data on the loans, the timing, and the location of these loans from EPA, and then studied what happened to drinking-water pollution and human health before, versus after, a public water system received a loan.
And so, our empirical approach leverages the differential timing when these loans were made, and we control for a whole host of other factors in our research design, including differences within states over time.
Margaret Walls: Yeah. Okay. Got it. And so, tell us about those basic pollution findings. And if you like, I said that you also looked at the cost-effectiveness of this program. So, tell us what you found.
Dave Keiser: Yeah, absolutely. I mean, we find that these loans are really effective at reducing pollution. The average loan reduces the share of readings above health standards by about 9 percent. We have a little less data on loans that identify a specific target, but for those loans, exceedances for the targeted pollutant fall by about 36 percent, which is a really significant improvement. And then, we look at how far out these improvements last, and we can see that they last for at least 10 years. So that’s on the pollution side of things: these loans are effective.
And then, in terms of the cost-effectiveness, we wanted to see, well, how effective is this loan program at reducing pollution? And so, we could ask, well, what would the cost be to remove the remaining exceedances if additional investments were just as effective on average as the ones that we study? And that calculation suggests that for about $50 per person per year, we could eliminate these exceedances of health standards.
Now, it’s really important to note, though, that although this is a useful benchmark for thinking about the scale of the problem, it’s an extrapolation. The last remaining problems could be more expensive to solve, and it’s not necessarily the estimate of the cost of eliminating every possible drinking-water risk.
Margaret Walls: Gotcha. But bottom line, it’s been a pretty cost-effective—not just effective—program.
Dave Keiser: Absolutely. I would say so.
Margaret Walls: All right. I said at the beginning, you also looked at the health effects. So, let’s start with something there about the data. Joe, can I turn to you for this? Tell us about this Medicare data you collected, and what health outcomes you were looking at, and so forth.
Joseph Shapiro: Yeah. I would say I came to it with a somewhat broad perspective, because I think of drinking water and health as one of the really classic questions in environmental health.
Some of the technologies that were created through the investments Dave was describing had been around since early human writing—like, they’re described in the Bible and in tombs of Egyptian pharaohs. And early investment in drinking water in the early 1900s, through filtration and disinfection, is sometimes considered one of the most cost-effective investments to improve health in the twentieth century.
So, we started looking at it in our data through administrative Medicare records that record the near universe of health outcomes for Americans over age 65 on Medicare. We access them through a confidential data environment set up at the National Bureau of Economic Research.
But in this setting, we observe the nine-digit ZIP code where each individual is located. That’s like a city block. It’s 200 times finer than a ZIP code. And that’s quite important for drinking water, because if you only know the county or the region where somebody is located—as you said, there’s 150,000 different drinking water systems in the country. And if only one of them is getting a loan, it’s important to know whose health exactly might improve.
So, we identify the locations where people live, quite precisely, and then we link them to these electronic maps that describe the territory that each drinking water system serves. We then follow people; we don’t follow locations. We follow people who live in a location that gets one of the Safe Drinking Water loans, and we follow them over time. Some of them move, some of them die, some win the lottery. Whatever happens, we follow them year after year and ask what happens to their health after the water system receives one of these loans. And then, we compare that evolution to people who live in areas that never received one of these water system loans.
And in these administrative data, we observe deaths of Medicare beneficiaries. We also observe hospitalizations, and then we have somewhat more coarse data that report infant health, and also some information on cause of death.
Margaret Walls: So what’d you find?
Joseph Shapiro: Before these loans happen, we find that mortality trends are pretty similar in areas that receive loans and those that don’t. And then, in the years after a group benefits from one of these loans, we find that the mortality rate of older Americans in these areas gradually declines. The decline takes a few years to accelerate, but is especially pronounced three to seven years after the loan. And if you aggregate it, we calculate that each first loan that a water system receives decreases the mortality rate of older Americans by about half a percent.
We break it out in a few different ways. We look at hospitalizations and find similar magnitude, although the hospitalization estimates are less precise. We also look at outcomes for chronic conditions, because one question we initially had is, Why is it that it takes a few years for health results to materialize?
The pollution results happen a little bit closer to when the loans are provided, and we find a pronounced concentration in the outcomes in chronic conditions that may take a while to accumulate exposure to pollution.
When we look at infant health, we have suggestive results, but the county estimates are much less precise. And we tried re-estimating all the analyses that Dave described for pollution at the county level, and also found that those were quite precise with the exact same data.
And our takeaway from it is that, to analyze drinking water, it’s extremely important to know the actual water system where the water is being provided where someone lives. It’s a little different than air pollution, where air pollution can mix somewhat smoothly through an airshed, through a county or a metro area, but drinking water is just flowing through pipes. And so, if you’re not in the water system benefiting from a loan, you don’t have the same capacity to benefit from it.
Margaret Walls: Yeah. Just a quick clarifying question on this data for hospitalizations and deaths. Do you have a sense of, What are the main health effects from a drinking-water improvement that these loans would make? Do you have a sense of what’s causing the deaths? What are the problems that lead to these negative outcomes that get ameliorated to a certain extent?
Joseph Shapiro: That is a fantastic question. For some environmental health threats, like extreme heat, it is much more straightforward to answer, because cardiorespiratory systems are really what’s stressed when somebody is exposed to extreme heat.
Drinking water is somewhat more complex. US industry produces or processes over 30,000 different chemicals. The Safe Drinking Water Act regulates 90. We have data on over 1,000. And if you list the different systems in the human body which can be harmed by the organic chemicals, inorganic chemicals, disinfection byproducts, radioactive compounds—it’s almost every system in the human body. There are some that are somewhat more pronounced, like the most immediately obvious would be gastrointestinal systems, because of exposure to microorganisms and pathogens. And so, we break those out individually. But otherwise, it’s somewhat different than extreme heat in that there’s not just one single system likely to be connected to this wide range of outcomes.
You could also think about other outcomes besides health that might be relevant, especially beyond hospitalizations and mortality. And the range of outcomes that might be affected by drinking-water pollution could include home values. If infants are exposed, their later education and human capital might be affected. There are many subclinical health problems, where people don’t end up at the hospital but might be sick or might go to the emergency department but not be admitted to the hospital. Many people also spend money on bottled water and on water filters. And so, we don’t frame the analysis of mortality and hospitalizations as a complete estimate of willingness to pay.
On the other hand, if you look at other health settings, like air pollution and extreme heat—if you try to quantify the monetized benefits that economists and health researchers estimate through different channels, prevented premature mortality is often an enormous share of the benefits of other environmental health settings. And so, we thought it was especially important to count those, even as we realize that’s not the full range of benefits that environmental goods can provide.
Margaret Walls: Yeah. Gotcha. And that’s leading to my next question, because you did a benefit-cost analysis of the Safe Drinking Water loans in the paper. Tell us how you went about that exercise, understanding these caveats that you just shared. You estimate the big, important parts, but there are other benefits that you’re not capturing.
Tell us how you went about the exercise. Joe, do you want to take that?
Joseph Shapiro: Sure. We calculate two numbers: measured benefits and measured costs. So let me explain each, and then we can take the ratio.
So, measured benefits: We ask, How many premature deaths did each of these drinking-water loans prevent? And then, how do people value those deaths?
Our calculation from these regressions is that the average loan prevented 18 deaths over the lifetime of water-quality benefits that it provided, which we assume to be 25 years, in line with some engineering estimates. And other research we’ve done, in an extension of sensitivity analysis, we say we only actually observe it for 10 years. So you could scale that down by a little more than half, conservatively, assuming it’s for 10 years.
And what’s the benefit of those premature deaths? We use a concept that’s quite common in environmental economics, the value of a statistical life, which is people’s willingness to pay to avoid changes in fatality risk.
And so, we combined the premature deaths with the estimated value of a statistical life from other literature, and we calculate that each loan provides about $52 million in benefits over the lifetime of improved water quality. So, 52 million is the numerator—that’s benefits and present value.
Then, the second number is the denominator: What’s the measured cost? As you all discussed earlier, the average loan costs about $3 million in capital costs. The federal government pays part of that; local and state governments pay the rest. In addition, during the lifetime of the loan, you have to operate and maintain that capital. That costs about another $3 million. And so, if you sum those up, you get a cost for the average loan of about $6 million.
Taking the ratio, we calculate a measured benefit-cost ratio of about eight. And you could say, “Is eight good or bad?” Well, it’s bigger than one! So, we measure benefits that are larger than the costs.
I also find it interesting to benchmark against other environmental investments that the federal government has made. So, Dave and I have another paper where we reviewed all the major regulations of environmental goods from the federal government in recent years, and eight is actually pretty similar to the average benefit-cost ratio that the Environmental Protection Agency estimates for other drinking-water regulations.
It is smaller than the average benefit-cost ratio for air-pollution regulations—they calculate that as about 12.5. And it is much larger than the average benefit-cost ratio that they estimate for surface-water investments, like cleaning up rivers, lakes, and streams, which is about 0.5.
Margaret Walls: Okay. That’s super helpful. Thanks for making that so short and sweet. People are going to have to read the paper to get more details.
And I want to tell folks that you have made this data, that you painstakingly gathered for this study, publicly available and have some thoughts about future research endeavors with this. So you want to say a few words about that? Dave, maybe you can go first on that. What are your thoughts about the most productive lines of future research?
Dave Keiser: Thanks, Margaret. So I’ll remind us of one of the staggering statistics you started us off with today, and that’s we have around 150,000 public-water systems in this country. And so, about one-third of those are community water systems that serve the same people year-round.
To help put that number in context, we have about 3,000 counties. And what that implies, then, is that we have quite a lot of small systems that don’t serve many people. Consolidating these systems is a potential solution that’s been proposed by EPA, as well as a number of states, although that consolidation action can be controversial. So, although we might expect returns to scales, some communities still want to retain control over their own system.
And I think a really interesting question, then, asks how effective these consolidations have been at both improving water quality as well as their fiscal implications. I’m working with a PhD student, Yingyi Jin, who’s at [the University of Massachusetts Amherst], to understand these consolidation impacts. More generally, I think the data will help open up new questions about how we can better manage our water systems and the fiscal consequences of those management decisions.
Margaret Walls: Okay. Joe, do you want to add anything? What do you think should be at the top of the list for people to be looking at?
Joseph Shapiro: I think the questions I’m excited about are the ones I don’t know of yet, that other people will come up with, and the benefit of having data out in the world as they can find it.
If you look at air-pollution research, much of that research uses readings on air-pollution concentrations, and then a subset uses non-attainment designations or non-attainment violations, which is a component of the Clean Air Act. What’s currently available online is closer to the non-attainment designations. It just says, When does a violation happen? And what’s available through these data we put together are the raw readings.
Dave talked about some specific water-pollution questions. I’ll just mention a couple broader econ questions where I think this is an excellent setting to learn about broader issues that are not only pertinent to drinking water.
One is, What’s the right level of government to solve public goods problems? Drinking water is different than most other environmental goods I’ve studied, because there’s not a lot of externality between cities in the treatment of drinking water. If Los Angeles invests to clean up its drinking water, that makes no difference for the drinking water of San Francisco; or the Central Valley; or like how Washington, DC, cleans up its own drinking-water-treatment system. It’s not going to help other areas nearby. That’s very different than other environmental goods.
And so, because drinking water is a purely local public good, most writers say local communities should deal with it. There’s no role for state or federal government, because there’s no externalities across space. But in this setting, we find the federal government is making these investments and creating mandates, and they have benefits that are considerable.
And then it leads to the question, Why is it that the federal government is intervening in a local public good, and it’s still creating positive returns? Is it information or access to credit, or what is it about the canonical fiscal federalism argument that means it might not be perfectly perceiving what’s happening with drinking water?
And then, the other broad question I find interesting—and this is a good place to study it—is that a lot of economic research, especially in environment and energy, tends to study regulated settings (power plants and oil refineries and air pollution), and there’s very good reason to study regulation. It’s up for policy debate. There’s a lot of data. There are research designs from policy variation, but it also has the risk of just looking where the light is shining, and maybe missing opportunities for learning about unregulated activity.
And something that’s unique about these data in drinking water is that the Safe Drinking Water Act is regulating 90 contaminants, but we have many thousands of contaminants flowing through drinking water in source waters, and states collect data on many of those contaminants, even though a large set of them is not regulated by states or the federal government. So, it provides an opportunity to learn about environmental goods that are regulated, and also those that are not regulated, in the same setting with the same kind of data, to understand, Are we getting a complete picture of environmental econ goods by focusing on regulated activity?
Margaret Walls: Thanks for that. Those are good thoughts.
I can’t get both of you on this show—two amazing experts on water issues—without talking about current policy. So we’re going to go beyond the paper and the data at this point. I just want to find out if you’re following current policy in this area and what you think about it.
So, a couple of things I would mention is, there was a lot of money made available for the Safe Drinking Water Revolving Loan program and the Bipartisan Infrastructure Law in 2021, but then there’s been a lot of changes since the Trump administration came in, and the president’s proposed fiscal 2026 budget proposed cuts to that program, which Congress rejected. And here we are again now, with the fiscal 2027 budget, again proposing a cut.
So I mean, obviously you’ve done a benefit-cost analysis of the program and so forth, but I just want to know if you have any general thoughts about where support for that program in particular (and for drinking-water issues in general) is going, what do you think is needed, and so forth?
Sorry to ask such a big policy question, but I just would love to get your thoughts on these things. Joe, do you want to start? Either one of you can chime in.
Joseph Shapiro: Yeah. I’ll start with a statistic that I can quote, since I’m not a politician, but I think it’s a relevant statistic to politicians, and economists sometimes blanch when I quote it.
Gallup has polled Americans every couple years on their top environmental concerns. And in a prior paper, Dave and I made a graph of these polls going back, I think, to 1989. And so, they ask Americans, “Are you concerned a great deal about climate change, air pollution, species extinction,” blah, blah, blah. In every single poll, the number one concern of Americans is drinking water. The number two concern is surface-water pollution. Climate change has gradually been catching up. It’s not quite there yet.
And so, politically, if you ask, “Where is there solid support around the country for environmental investments?,” this has left other goods in the dust for quite a while in average National Gallup polls. That’s not the only thing that matters, but it’s certainly pertinent. So when you see funding getting cut and restored, I think at a deep level, that’s probably one driver.
And then, for our paper specifically, I’ve been surprised how clear the signal is of the impact of these investments that we analyzed. It’s very clear from data: concrete is getting poured, water quality is improving, health is responding, loans are reaching a broad set of water systems. The value judgment about how much to spend is subject to lots of political considerations. But I think those are the two main points I would make. This is Americans’ top environmental concern, and then our analysis shows that it’s having clear impacts on the metrics we analyzed.
Margaret Walls: Yeah. Okay. I think I’ll have to leave that at our last substantive question, although as usual, I feel like we could have a whole second podcast on some of this. So write another paper, won’t you, and come back on.
I need to close with our regular feature we call Top of the Stack, and that’s where we’re going to ask you to recommend something to our listeners, a book or a podcast, or an article—anything that has caught your attention lately. What’s on the top of your stack? Dave, I’ll start with you.
Dave Keiser: Sure. I’ve been reading this article—it’s a two-part article—by Professor William Andreen, who was at the University of Alabama Law School. And he has an article in the Stanford Environmental Law Journal from the early 2000s; I think it was 2003. I found this article just really fascinating, because he traces water-pollution control in the United States from colonial times up to the passage of the Clean Water Act in 1972.
I’m currently teaching a class on clean water policy in the United States, and that article has just been really fun to read. It’s incredibly well written, and just a fascinating look at the history of clean water in this country. So, it’s the top of my stack, and I highly recommend it.
Margaret Walls: Okay. I love that recommendation. What about you, Joe? Do you have something on the top of your stack?
Joseph Shapiro: I’ll give you an extracurricular read. It’s called The Lost City of the Monkey God by Douglas Preston. It is a thriller nonfiction book about using remote sensing and LiDAR to identify historic civilizations in Honduras. The remote sensing tries to identify them, and then archaeologists go visit in person. It’s a combination of environment and geography and history, and it’s fascinating and very exciting. I definitely recommend it.
Margaret Walls: Fantastic. I love it. All right, that’s great.
Joe Shapiro and Dave Keiser, thank you so much for coming on Resources Radio, talking about safe drinking water and this really important new research that you’ve done on health outcomes, water pollution, and water policy in the United States. I’m going to encourage everyone to read this amazing paper. Thanks, you guys, for coming on the show.
Dave Keiser: Thank you so much.
Joseph Shapiro: Yeah, thanks Margaret. A lot of fun.
Margaret Walls: You’ve been listening to Resources Radio, a podcast from Resources for the Future. If you have a minute, we’d really appreciate you leaving us a rating or comment on your podcast platform of choice. Also, feel free to send us your suggestions for future episodes.
This podcast is made possible with the generous financial support of our listeners. You can help us continue producing these kinds of discussions on the topics that you care about by making a donation to Resources for the Future online at rff.org/donate.
RFF is an independent, nonprofit research institution in Washington, DC. Our mission is to improve environmental, energy, and natural resource decisions through impartial economic research and policy engagement.
The views expressed on this podcast are solely those of the podcast guests and may differ from those of RFF experts, its officers, or its directors. RFF does not take positions on specific legislative proposals.
Resources Radio is produced by Elizabeth Wason, with music by Daniel Raimi. Join us next week for another episode.