Insurance coverage is getting harder for homeowners to maintain—particularly in areas of the United States where extreme weather events are wreaking havoc.
Extreme weather events in the United States are on the rise. In a three-part blog series that we published in 2024, we show the three-decade trend in property damages from these types of events—a 6.5 percent average annual increase between 1995 and 2022. While the largest damages come from hurricanes and are thus concentrated along the Gulf Coast in states like Florida and Louisiana, other events such as thunderstorms, hail, winter storms, wildfires, and tornadoes also are significant, and some of them occur much more frequently than hurricanes. A key conclusion from our 2024 analysis was that no place in the United States is truly immune to extreme weather events, and a single event can cause catastrophic damages.
Homeowners insurance is an important financial instrument for managing losses from weather extremes. Several studies have shown that people recover more quickly and more completely from a disaster when they have access to insurance. In recent years, however, insurance markets have begun to exhibit problems. Insurance premiums have risen substantially in some locations. Homeowners have been dropped by their insurers and have received less than full coverage for damages when claims are filed. The insurance industry has felt some pain itself, with four years in a row of underwriting losses beginning in 2020. In some states, Florida chief among them, many smaller companies have filed for bankruptcy.
In this article, we explore the connections among these trends. Specifically, we analyze how the dynamics of extreme weather events affect insurance underwriting losses and how those losses, in turn, affect insurance premiums and policy nonrenewals. The analysis provides a window into how storm events have ripple effects through insurance markets and the safety net that insurance provides.
Understanding these dynamics helps identify which communities are more likely to face challenges with insurance affordability and availability after future storms, allowing homeowners, regulators, and policymakers to anticipate market stress and prepare accordingly.
Our insurance data are from a 2025 study by the Federal Insurance Office (FIO), which is housed in the US Department of the Treasury. Partnering with the National Association of Insurance Commissioners, the FIO collected data on homeowners insurance premiums, claims, policy nonrenewals, and insurer losses during the five-year period 2018–2022. The FIO report (no longer available on the Treasury website), summarizes geographic patterns and trends over time in insurance market outcomes at the ZIP code level and assesses the relationship between those outcomes and a spatially varying measure of weather-related risks from the Federal Emergency Management Agency’s National Risk Index.
One of the main findings from the FIO analysis is that ZIP codes with a higher percentage of building value at risk (according to the National Risk Index measure) tend to have higher average insurance premiums, higher frequency and severity of claims, higher policy nonrenewal rates, and higher insurer loss ratios (i.e., claims paid as a fraction of premiums collected). The Southeast region stands out, with higher-than-average premiums, claims, and nonrenewal rates—but high-risk ZIP codes in every region experience these outcomes.
We build on the FIO report in three ways. First, rather than using a static measure of weather-related risk from the National Risk Index, we use property damages from actual individual storm events. Second, we use regression analysis to evaluate how changes in the magnitude of those property damages affect insurer loss ratios. Third, we analyze how loss ratios affect insurer underwriting decisions—specifically, average premiums and policy nonrenewal rates. In essence, we ask whether insurers respond to extreme-loss events by charging higher premiums and/or dropping customers.
Taken as a whole, our analysis sheds some light on the dynamics of outcomes in insurance markets, i.e., the extent to which the severity of storm events in a given year affects insurance market outcomes in subsequent years. Understanding these dynamics helps identify which communities are more likely to face challenges with insurance affordability and availability after future storms, allowing homeowners, regulators, and policymakers to anticipate market stress and prepare accordingly.
Our data on property damage come from the National Oceanic and Atmospheric Administration’s Storm Events Database. In the first blog post of our three-part series in 2024, we describe these data and how they are pulled together by the agency through 123 National Weather Service offices across the country. We processed and aggregated the data to the county level and collapsed the National Oceanic and Atmospheric Administration’s 48 separate event types into 8 categories, ultimately organizing the raw data by type of weather event, county, and year for the 1995–2022 time period. (We made the processed data set publicly available on the Harvard Dataverse website.)
For the new analysis that we’re describing in this article, we examined seven event types—drought, flood, heat, hurricane, thunderstorm-wind-hail, tornado, and winter weather—and exclude wildfire due to substantial gaps in damage data from wildfire events within the data set. As a result, we focused on the Eastern United States, where wildfire exposure is lower.
In Figure 1, we show a map of these data for the 2018–2022 time period (to match with the insurance data) on a per-housing-unit basis. Because storm damages are observed at the county level, we allocated damages to ZIP codes within each county in proportion to their baseline risk. Specifically, we used each ZIP code’s expected annual building loss (from the National Risk Index) as a weight to distribute total county-level damages to the ZIP code level.
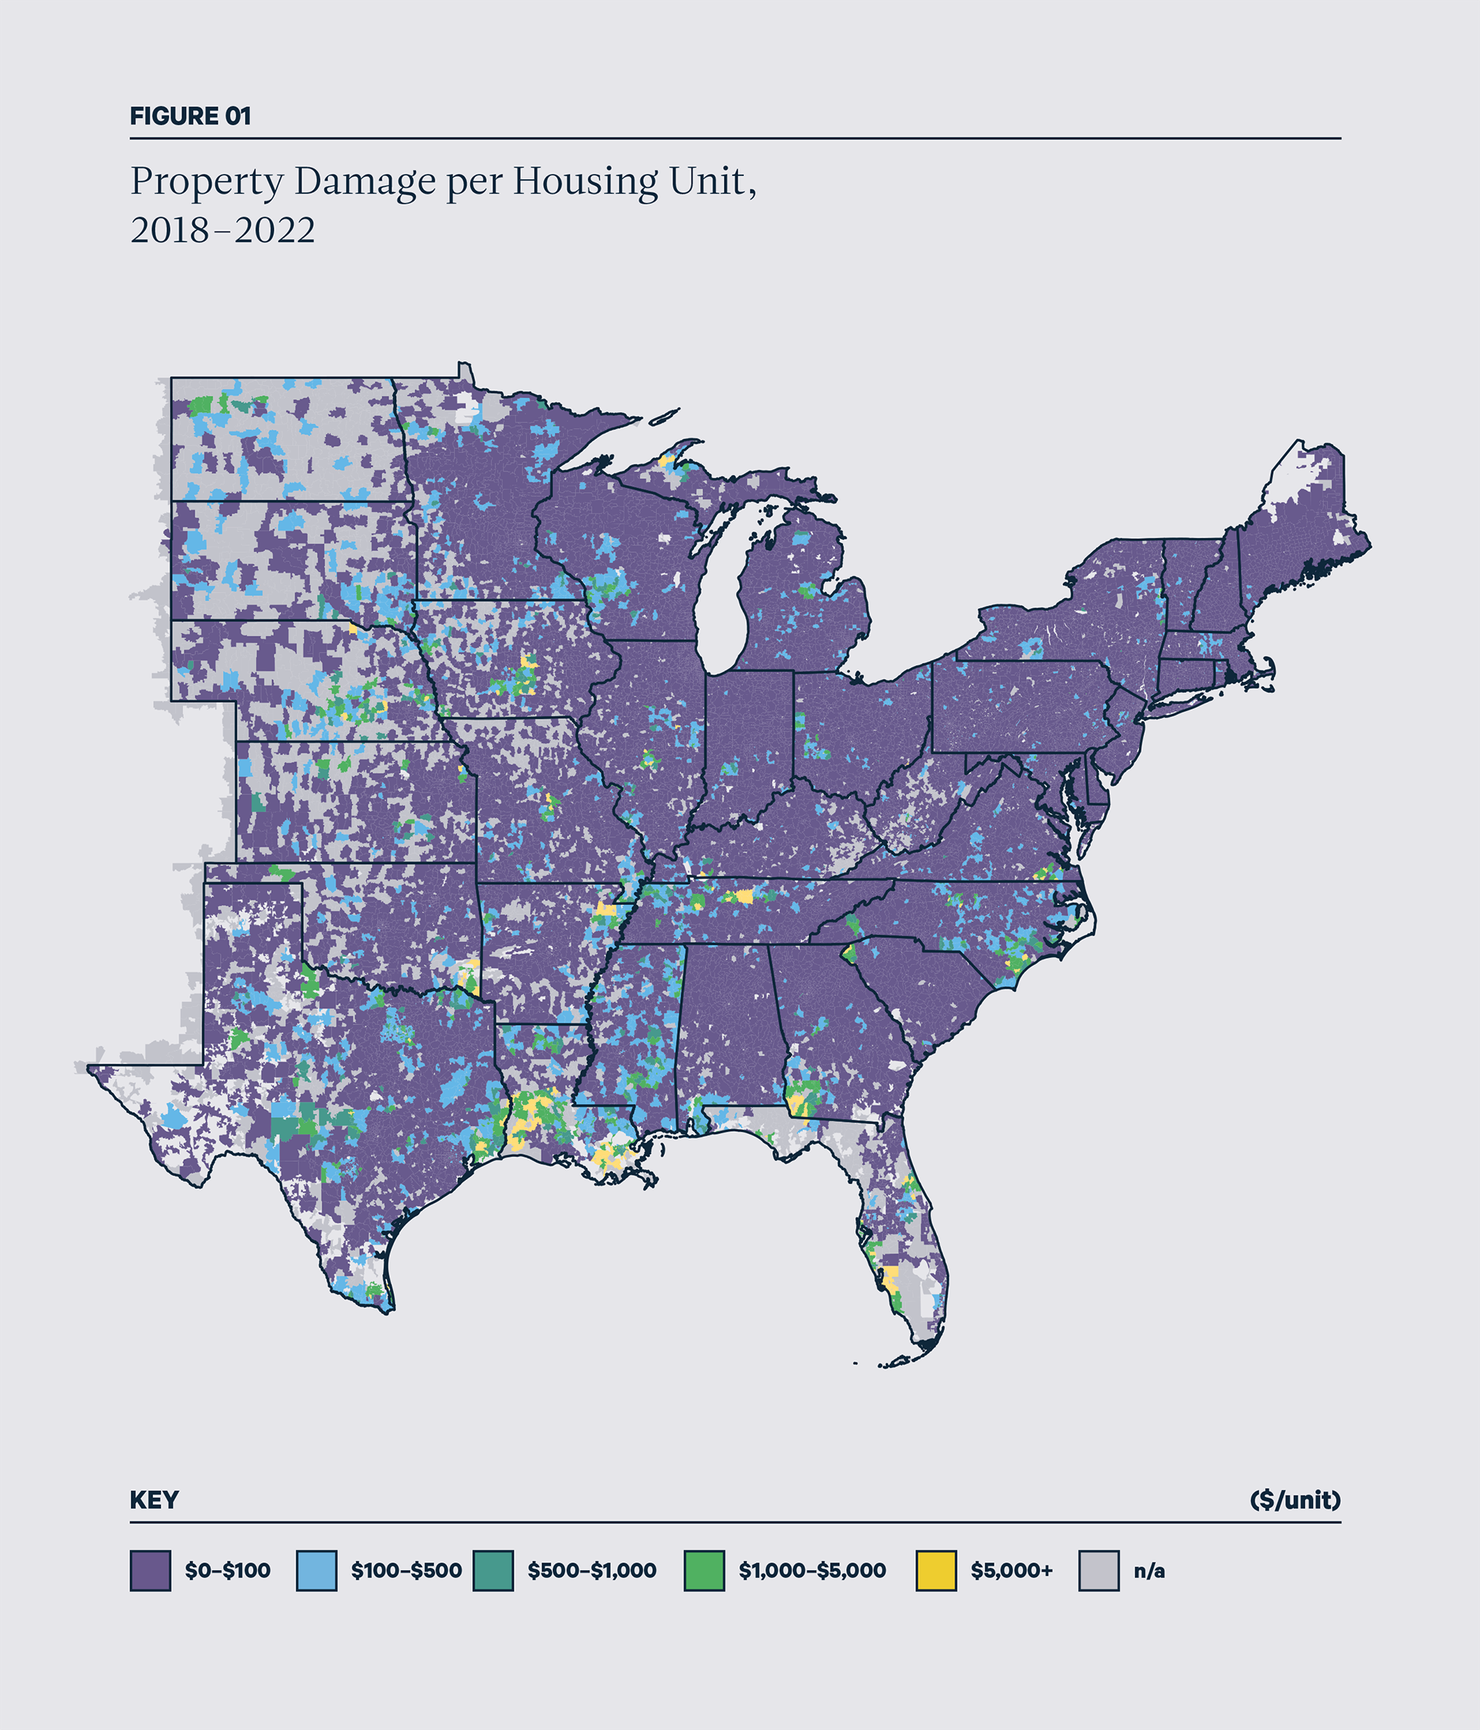
Note: To protect the privacy of homeowners and insurers, the Federal Insurance Office excludes some ZIP codes with small numbers of policies; these are the “n/a” ZIP codes.
The map in Figure 1 shows distinct clusters of high property damage, especially in Southern coastal states such as Florida, Georgia, Louisiana, North Carolina, and Texas, with additional hot spots emerging across parts of the Midwest. These patterns are consistent with the longer-term distribution of property damages in our previous blog post on the geographic distribution of impacts from extreme weather, while also reflecting some unique differences during this shorter and more recent period.
Figure 2 shows insurer loss experiences by ZIP code during the 2018–2022 time period. Specifically, the map displays the number of years over the five-year period when loss ratios in each ZIP code were greater than one (i.e., claims paid exceeded premiums collected) which we label as “large-loss years.” While most ZIP codes experienced no or only one such year, 438 ZIP codes had three or more large-loss years, over half of which are located in the Southern coastal states and the Midwest. In particular, parts of Alabama, Georgia, and Louisiana, as well as areas in Iowa and Nebraska in the Midwest, show patterns similar to those in Figure 1.
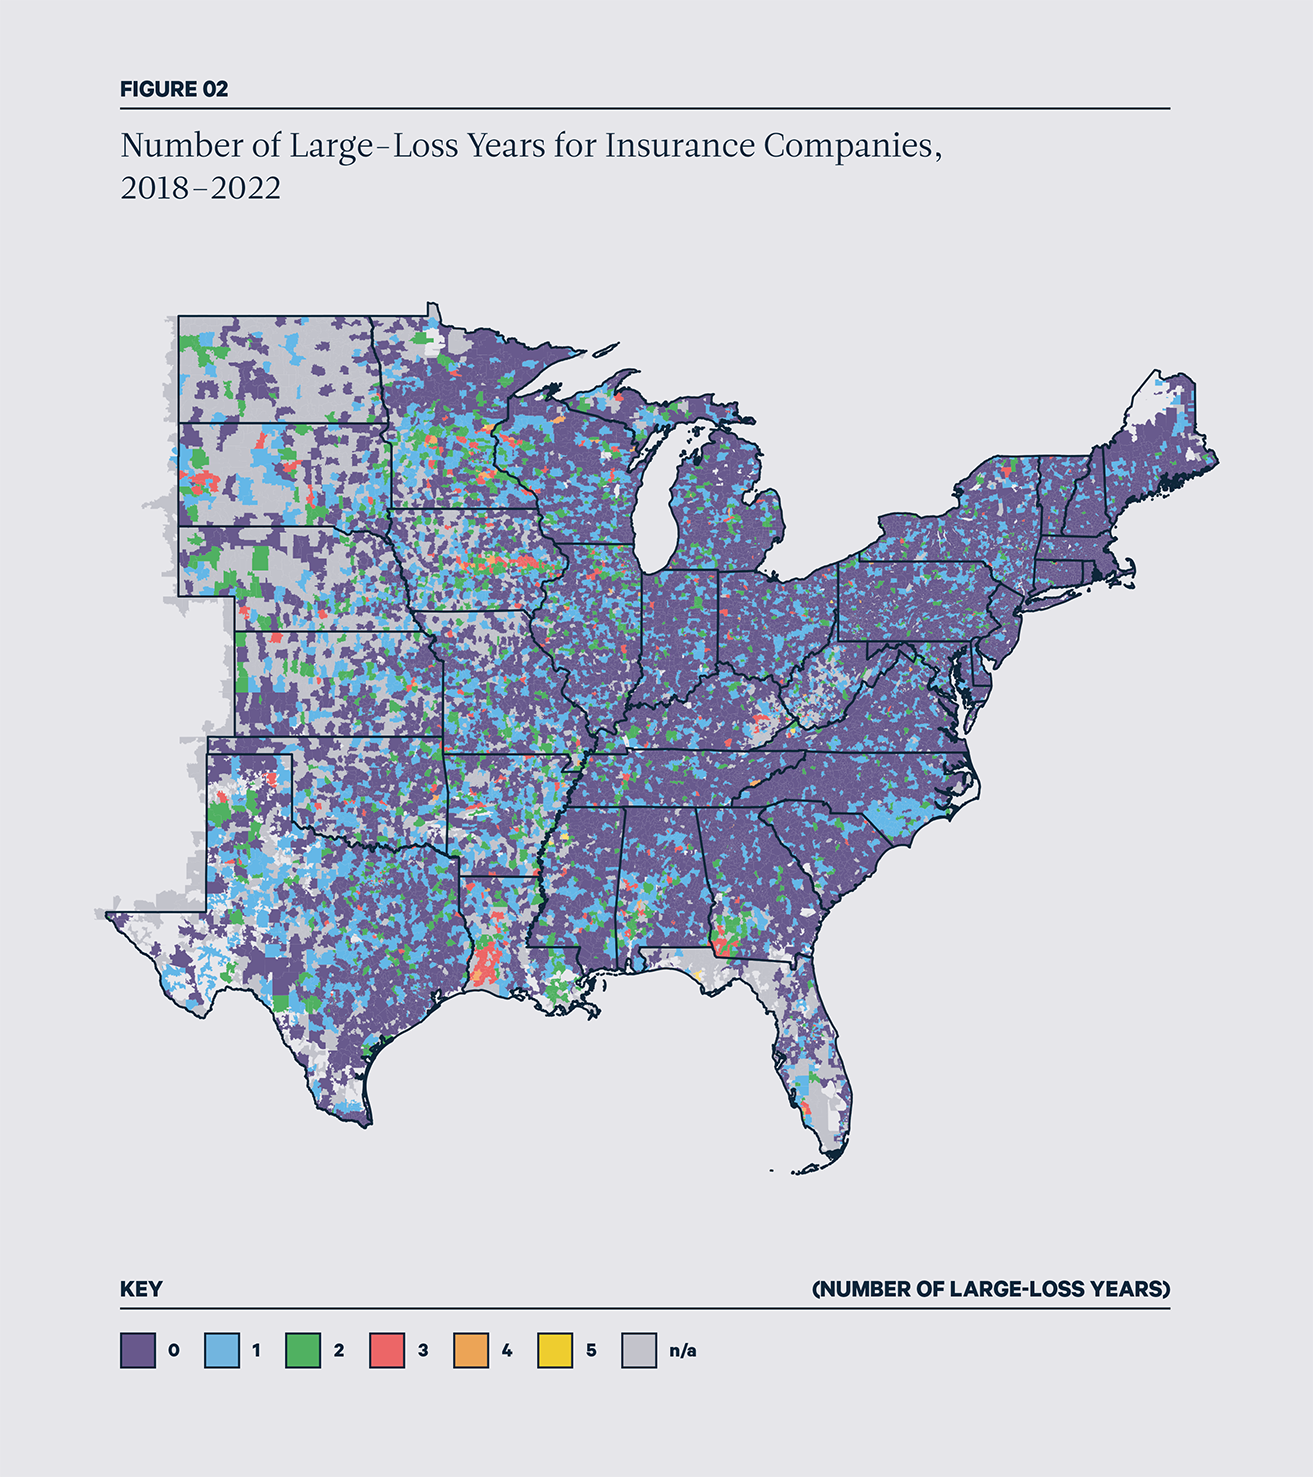
Note: To protect the privacy of homeowners and insurers, the Federal Insurance Office excludes some ZIP codes with small numbers of policies; these are the “n/a” ZIP codes. In Florida, data from Citizens Property Insurance Corporation, which has a significant market share, also are excluded.
Storm damages do not always translate directly into large losses for insurance companies. For one thing, not all damaged properties are insured; a growing body of evidence shows a pervasive gap for insurance protection. Even when properties are insured, some losses fall below deductibles and are paid out of pocket by homeowners.
Second, insurance policies often exclude certain types of damage. For example, standard homeowners insurance policies in the United States typically do not cover flood damage (and some exclude wind damage), which requires separate coverage. Given these factors, how much do storm damages affect insurer losses?
To answer this question, we conducted a regression analysis to examine whether higher storm damages increase the likelihood of insurers experiencing a large-loss year, while holding constant the baseline characteristics of the ZIP codes and controlling for changes in local socioeconomic conditions over time. We find that higher storm damage makes large-loss years noticeably more likely. An increase in storm damage per property of one standard deviation, which is about $1,100, increases the probability that insurers end up underwater by about 2 percentage points, or about 25 percent above the usual level. This substantial increase suggests that even among the wide range of risks these policies cover—such as theft, house fires, water damage, and liability claims—storm damage is an important driver of insurer losses and meaningfully affects insurer bottom lines.
Figure 3 highlights where the largest changes in insurance underwriting occurred over the 2018–2022 period. Panel A shows, for each ZIP code, the percentage change in average insurance premiums over the five-year period, and panel B shows the change in nonrenewal rates in percentage terms.
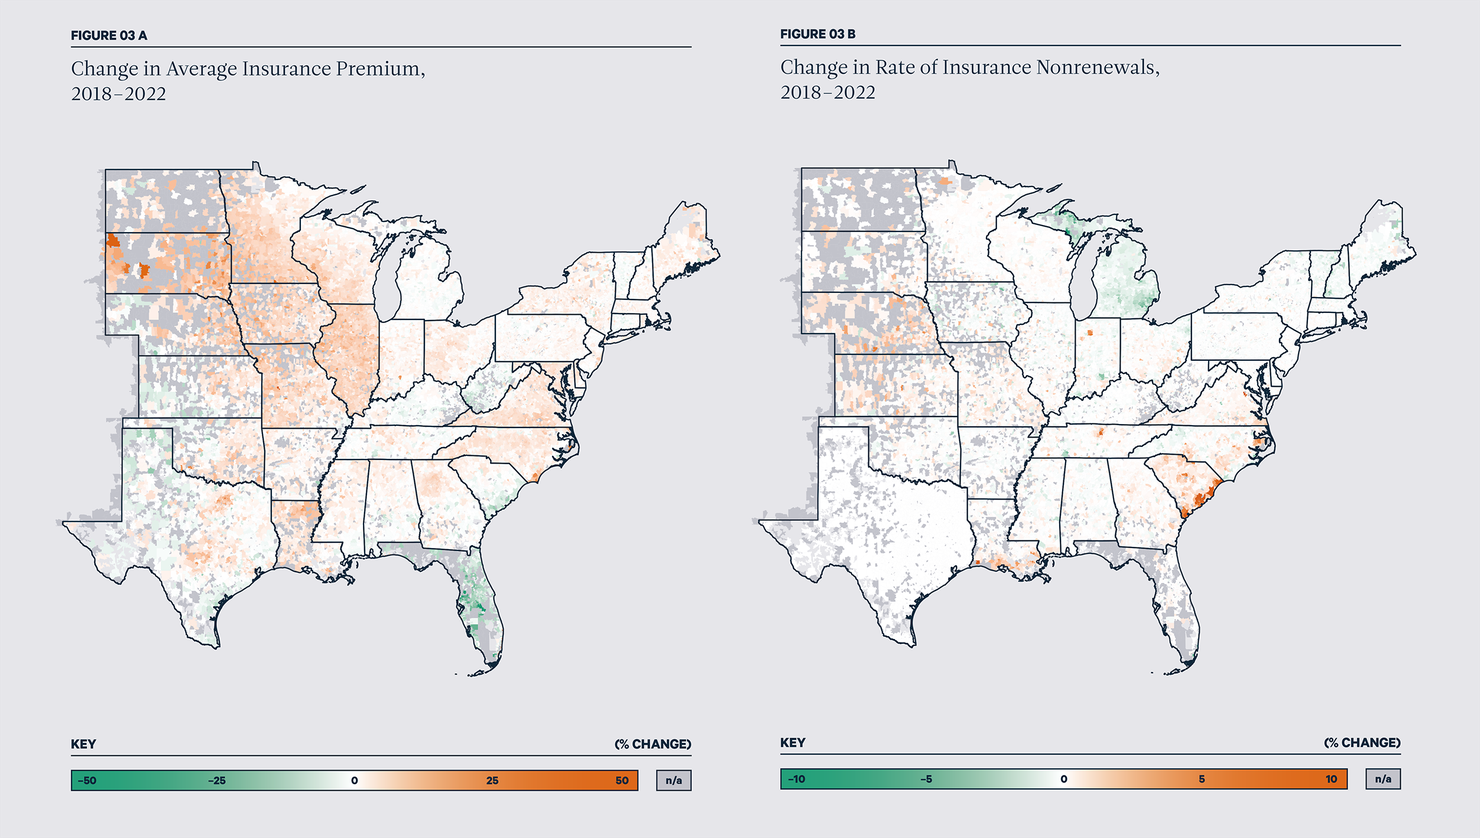
Note: For display purposes, percent changes in premiums are capped at 50 percent in absolute value, which affects 19 ZIP codes. Change in nonrenewal rates are capped at 10 percent in absolute value, which affects 25 ZIP codes. Gray areas are ZIP codes with missing data.
Source: US Treasury Federal Insurance Office (2026)
Most ZIP codes saw higher insurance premiums, and the average increase for the sample as a whole was 5 percent. The largest increases are concentrated in parts of the Upper Midwest, particularly Illinois and South Dakota, as well as in Louisiana and the Carolinas.
In other states, the pattern is more mixed, with some areas seeing premium rises and others experiencing little change or even declines. In Texas, for example, ZIP codes in Central Texas and around the Houston area saw premium increases, while many ZIP codes in the western part of the state saw decreases.
Florida stands out in particular, as many ZIP codes there show substantial premium declines. However, this finding should be interpreted with caution. The FIO data provide an incomplete picture of Florida’s insurance market because they exclude small insurers—which make up a large share of Florida’s market—as well as Florida’s state-created insurer of last resort, Citizens Property Insurance Corporation, which accounted for more than 20 percent of the market during our study period. As a result, the premium patterns we observe may not fully reflect broader market conditions in Florida.
When it comes to nonrenewal rates, most ZIP codes experienced relatively little change (i.e., less than 2 percentage points in either direction). However, a handful of areas saw sharp increases. The most striking example is along the coast of South Carolina, where 3 ZIP codes experienced increased nonrenewals of more than 20 percentage points, and 15 others saw increases exceeding 10 percentage points. Other states with notable increases in nonrenewals included Kansas, Nebraska, North Carolina, and Virginia, and parts of coastal Louisiana.
Comparing the changes observed for insurance premiums and nonrenewals reveals an interesting pattern. In some places (e.g., Kansas and Nebraska), premium increases and nonrenewals rose together. In others (most notably coastal South Carolina), nonrenewals increased even where premiums did not rise as much or even declined. These inconsistent patterns suggest that insurance market stress can show up in different ways across communities: in some areas through higher prices, and in others through reduced coverage availability.
To understand how previous loss experiences shape these underwriting outcomes, we estimated in our regression model how large losses in a given year affect premiums and nonrenewals in the following three years, again holding constant baseline ZIP code characteristics and changing local economic conditions (Figure 4).
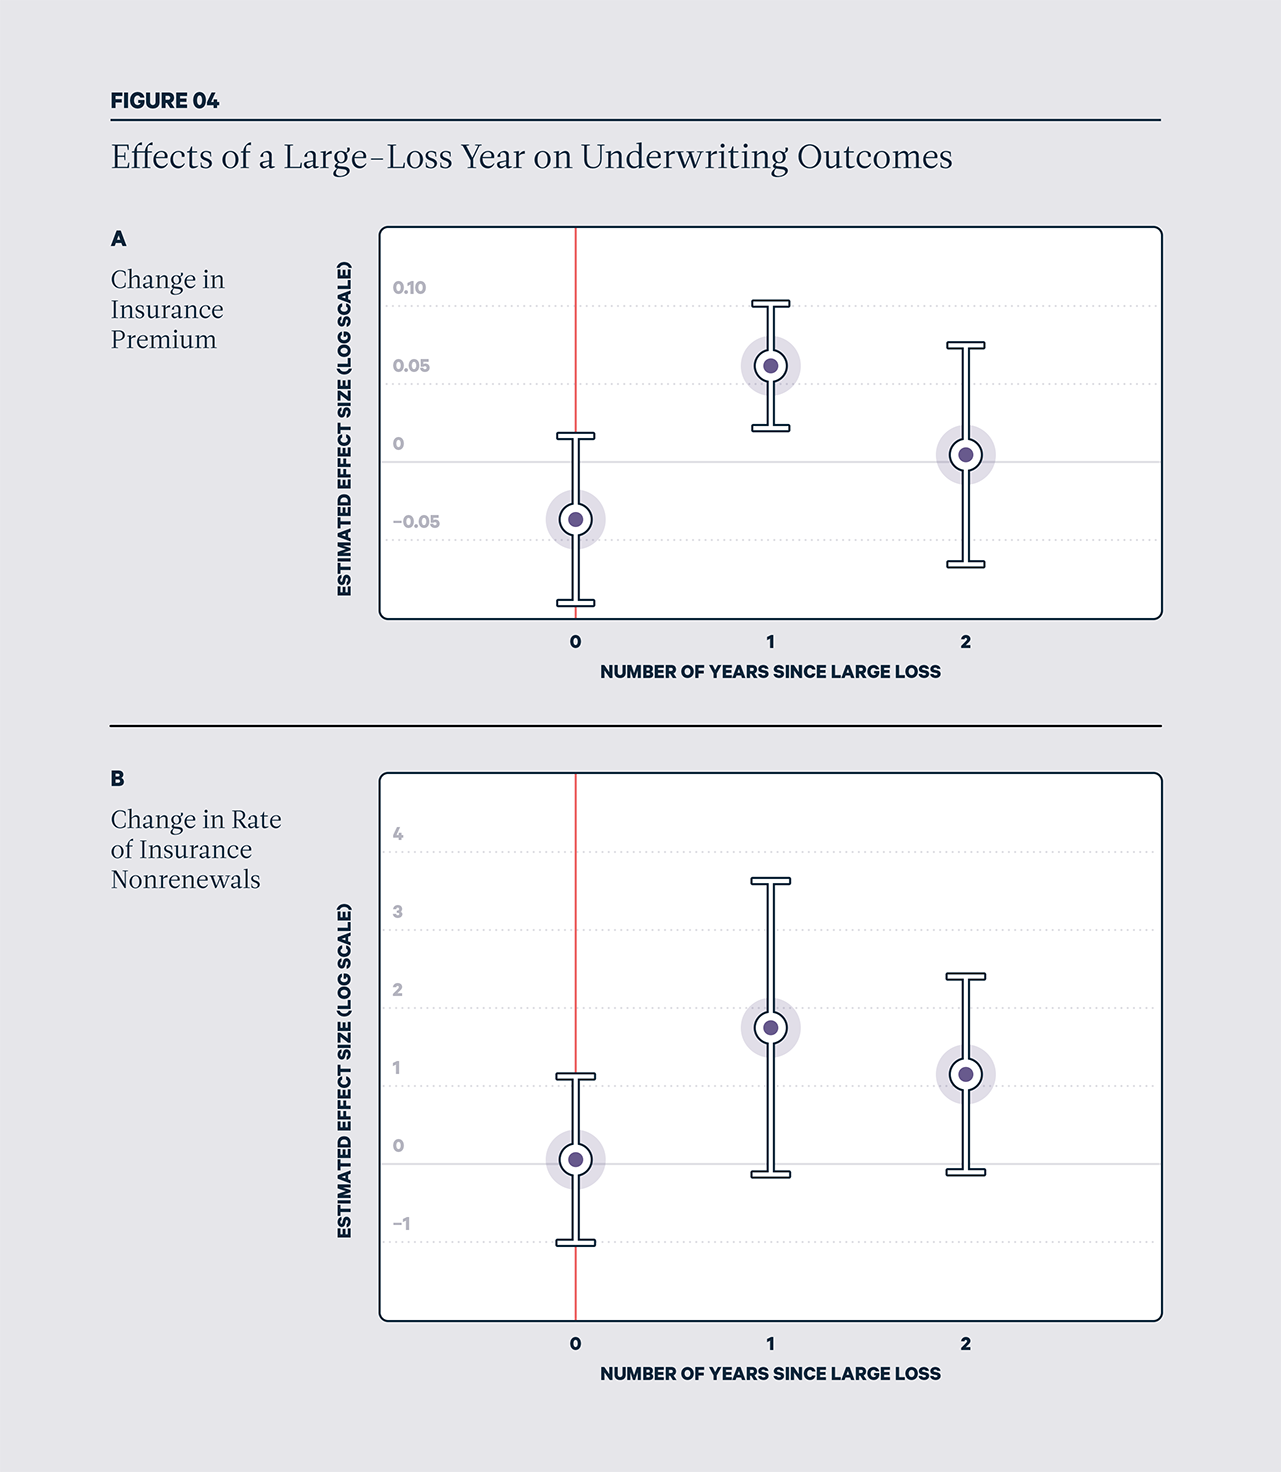
Average premiums did not change meaningfully in the same year as a large loss, but they increased by 6.2 percent in the following year (Figure 4A). The effect then faded out in the second year following the large loss. A similar pattern shows up for nonrenewals (Figure 4B), with no immediate change in the nonrenewal rate—but in the year following a large loss, the nonrenewal rate rose by 1.7 percentage points. Nonrenewals decreased slightly to 1.1 percentage points in the second year after the loss. (Both estimates are statistically significant at the 10 percent level.)
Together, these patterns suggest that insurers typically raise premiums and cancel policies in the year following a large loss, likely because companies reassess risk and adjust to financial pressures. In a separate study, we found similar results for wildfires in California.
Importantly, our results reflect average premiums and nonrenewal rates at the ZIP code level. These averages can mask important differences within communities, in that some neighborhoods may face more severe insurance challenges than the ZIP code average suggests.
What do we learn from this analysis? In our earlier Storm Watch blog post, we show that a single severe weather event can cause enormous, often unexpected, damage in a county. Here, we show that these events can have ripple effects beyond direct physical damage. When insurers experience large losses from extreme weather, they often respond in the following year by raising premiums or choosing not to renew policies when rate increases are constrained by regulations. Nonrenewals can be especially disruptive, pushing homeowners to purchase policies from residual insurance plans, often referred to as insurers of last resort (which typically offer more “bare-bones” coverage at higher cost) and making mortgage loans and home purchases more difficult. Because homeowners insurance is offered on a year-by-year basis, insurers can make big changes in who they cover and at what cost in a short amount of time, leaving homeowners—many with 30-year mortgages—scrambling to find coverage. Premium increases, even when justified by increased risk, can strain household budgets and add to housing affordability challenges. Premium increases also may lead some homeowners to reduce or drop coverage, particularly those without mortgages—leaving those households without financial protection when the next storm hits.
Credit: Getty Images / Unsplash
While this year’s hurricane season may turn out to be milder due to the possible development of El Niño, our analysis shows that other types of storm events, such as severe thunderstorms, tornadoes, and winter storms, also disrupt insurance markets. Recent analyses from the insurance industry concur: weather events known as “frequency perils”—thunderstorms, winter storms, wildfires, and inland floods—now account for almost two-thirds of global average annual property losses.
As problems multiply in homeowners insurance markets, states are taking various approaches to reform insurance regulations and the structure of residual insurance programs. These approaches target changes in premiums, deductibles, coverage, rate-setting methodologies, nonrenewals, and incentives and assistance programs for mitigation. Our findings suggest that severe losses from extreme weather events should be an important consideration in these reforms.
As for the volatility of insurer responses to severe losses, both long-run changes due to rising risks and year-to-year fluctuations may be difficult for households to manage. Our results can help policymakers anticipate where and when these fluctuations in premium increases and losses are likely to emerge—and the related effects on policies that simultaneously consider solvency for insurance providers, insurance affordability for households, and management of weather-related risks for all parties involved.
The findings also provide further support for investing in hazard mitigation to reduce losses in storm events, thereby leading to fewer disruptions in homeowners insurance markets. Two important and increasingly popular examples of state policies encourage homeowners to invest in mitigation at the property level: mandated discounts on insurance premiums and hazard-mitigation grant programs.
A version of this article appeared in print in the Spring/Summer 2026 issue of Resources magazine.